References:
- canvasDesigner: a versatile interactive high-resolution scientific multi-panel visualization toolkit. B. Zhang, S. Zhao, I. Neuhaus. Bioinformatics, 1 October 2018, 34(19):3419-3420.
- CanvasXpress is a standalone JavaScript library for interative data exploration and exporting scientific plots in SVG format.
- canvasDesigner User Guide
canvasDesigner Demo Video
Change Font Size
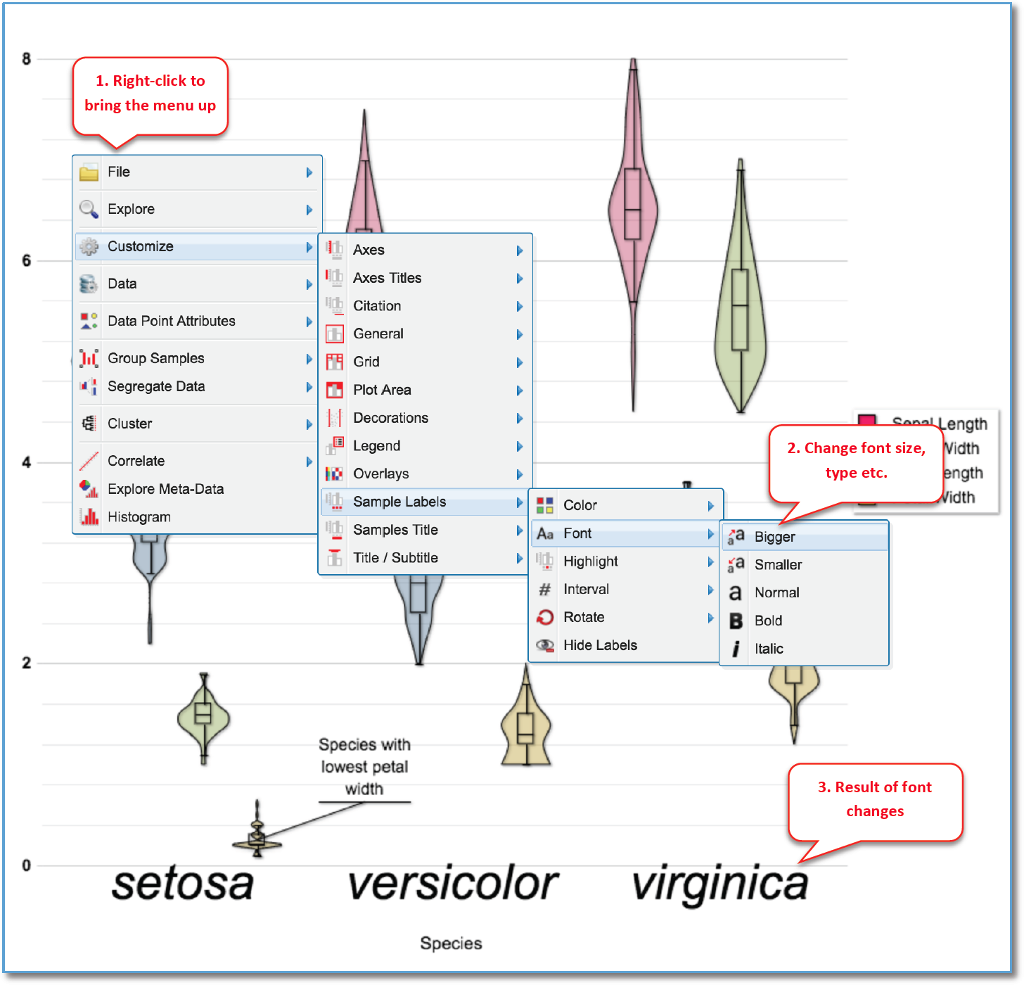
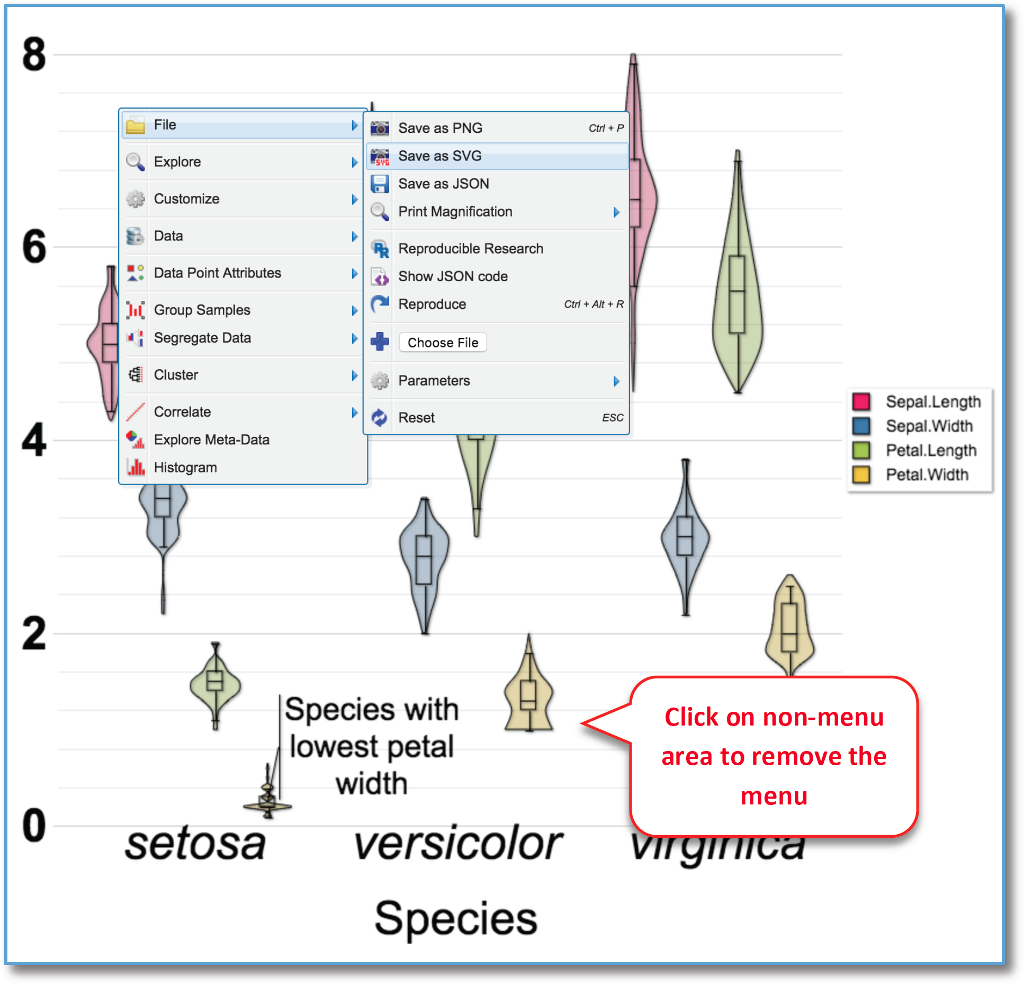
Font sizes of the title, axial labels and legend of a canvasXpress plot can be changed through the menu of each individual plot as shown in the following steps. After font customization, the plot can be saved in SVG format to be used in canvasDesigner tool. We will use figure D (https://baohongz.github.io/canvasDesigner/violin.html) in demo 1 as an example.
- Change font size of sample label
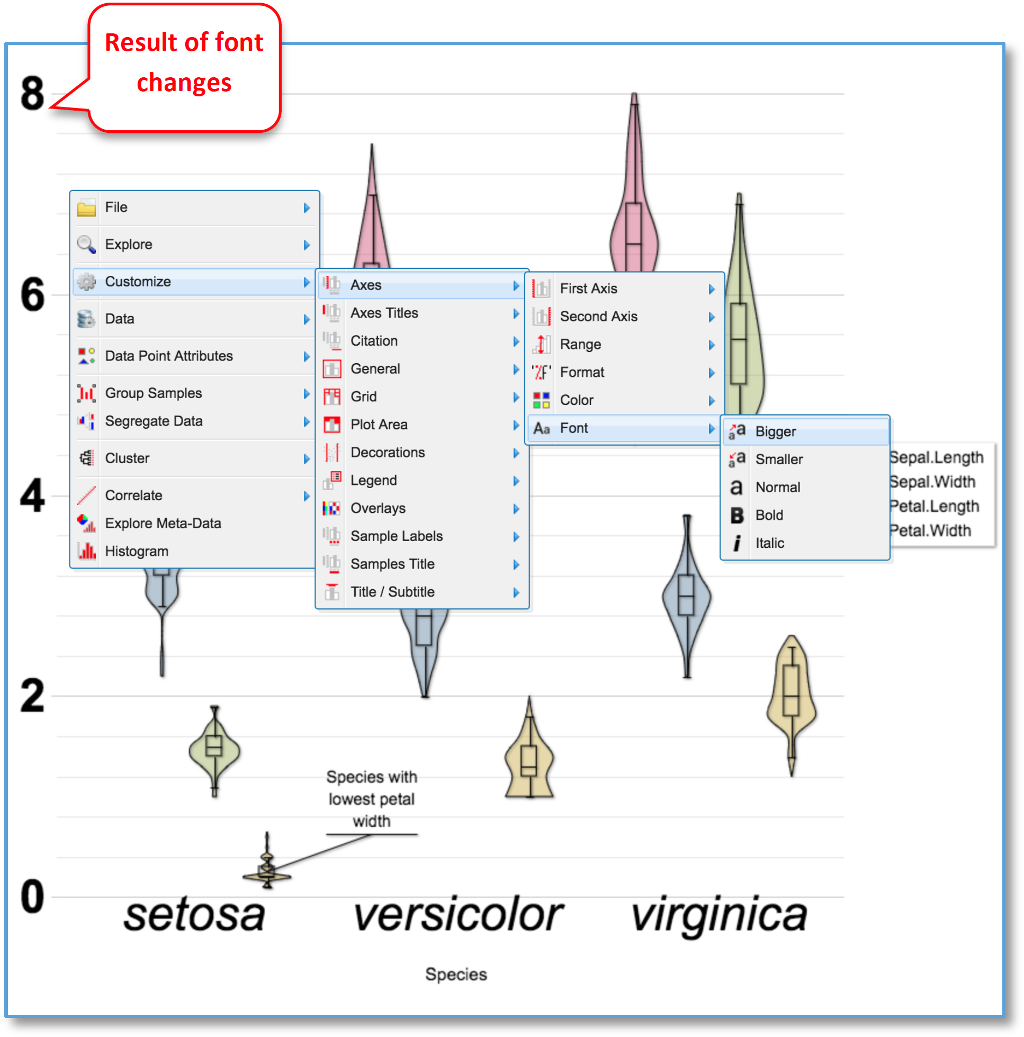
- Change font size of y-axis label
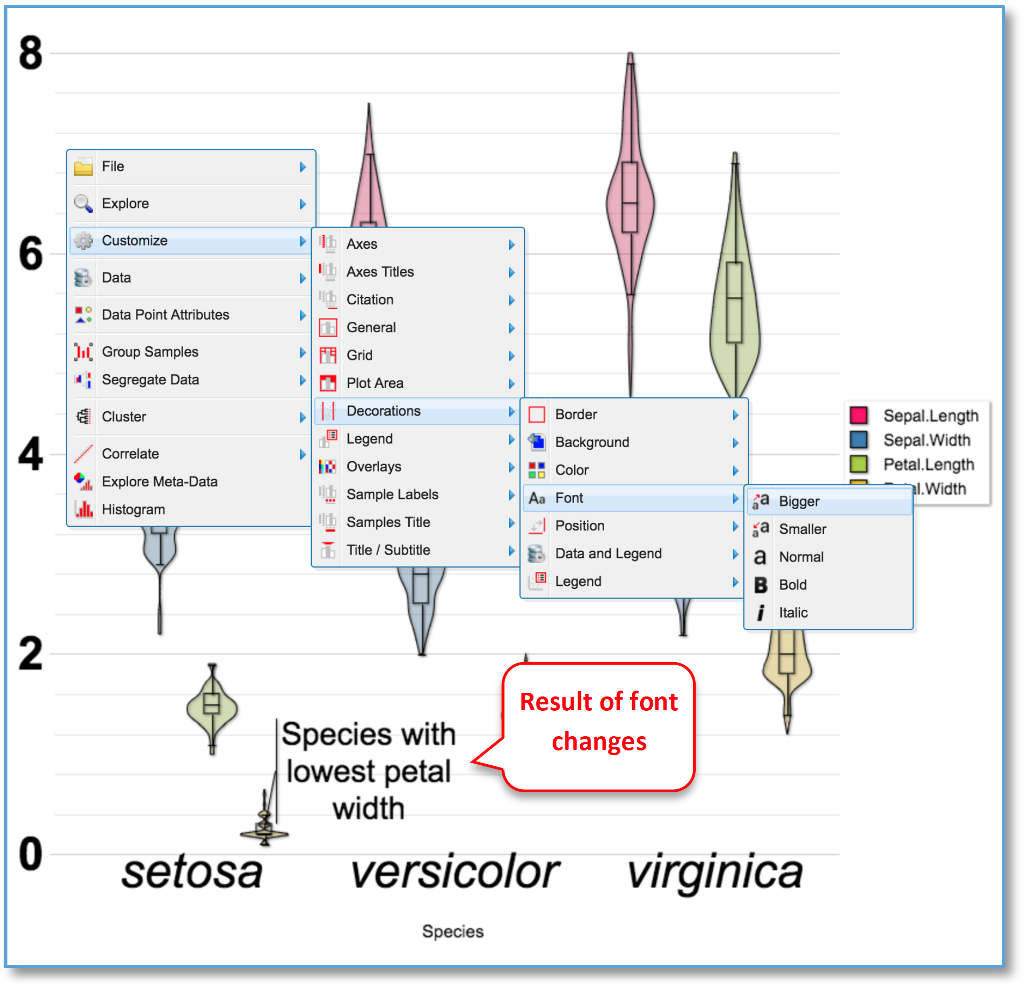
- Change font size of plot decoration
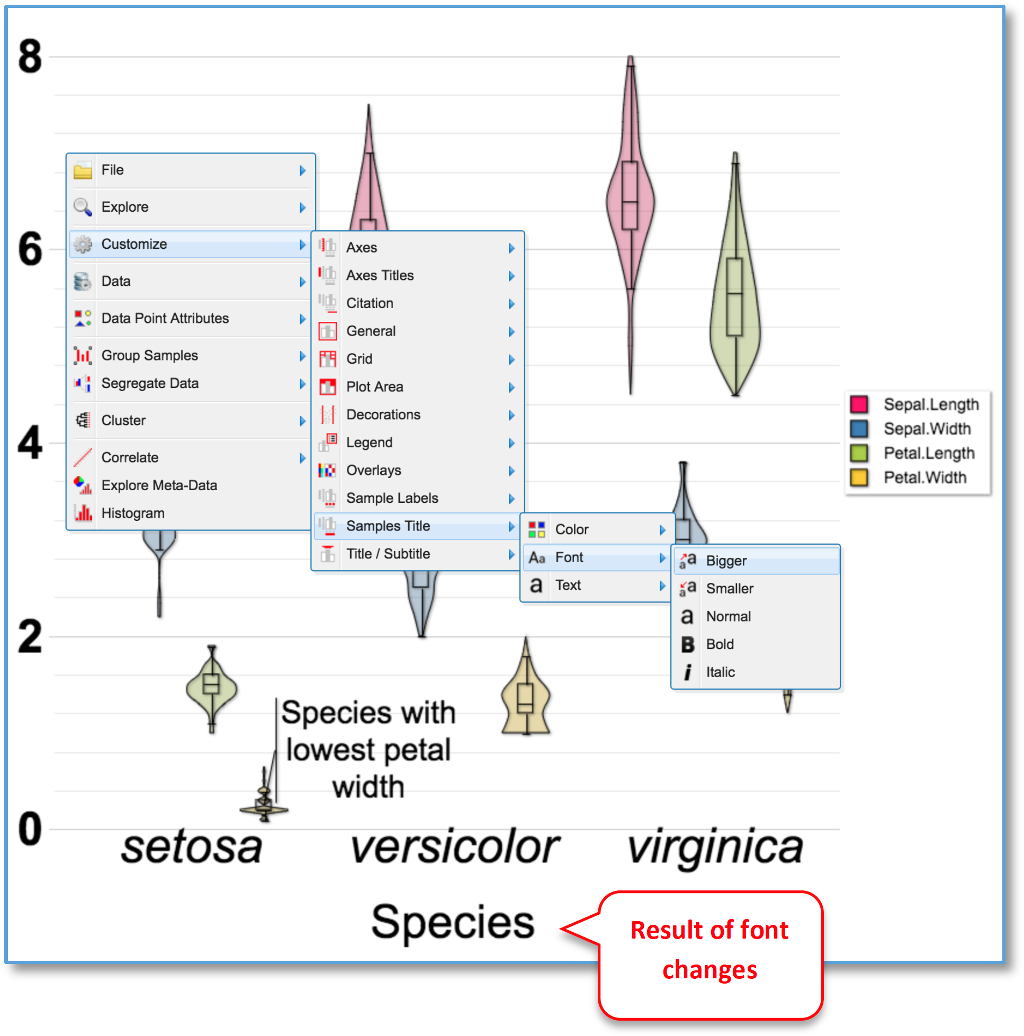
- Change font size of sample title
- Save the plot with bigger font in SVG format as violin_bigfont.svg
- Before the replacement of figure D

- Replace figure D in demo 1 (https://baohongz.github.io/canvasDesigner/demo1.html) by violin_bigfont.svg, see the video guide below
- After the replacement, please note the enlarged font in figure D
Source Code