Add Plot
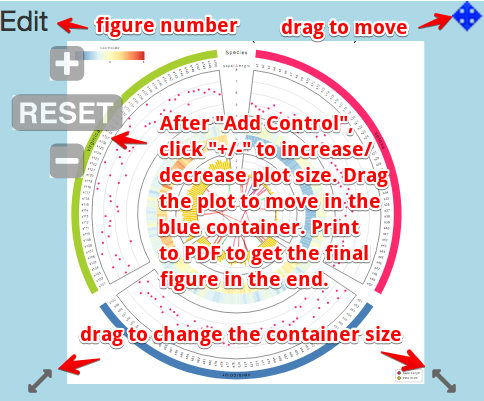
Add Control
Save as HTML
Index
Saved HTML
Saved HTML (big font)
Help
Drop a SVG file here or click to upload. Then click "Add Plot" to add to the designing canvas. Note: use Inkscape to convert PNG, JPG, GIF, TIFF to SVG format.
0
2
4
6
8
Species
setosa
versicolor
virginica
Species with
lowest petal
width
Sepal.Length
Sepal.Width
Petal.Length
Petal.Width
Iris flower data set
-8
0
8
0
50
100
150
Sample11
Sample19
Sample9
Sample25
Sample13
Sample7
Sample17
Sample15
Sample21
Sample23
Sample8
Sample24
Sample16
Sample12
Sample10
Sample14
Sample6
Sample20
Sample18
Sample22
Sample3
Sample5
Sample1
Sample2
Sample4
Probe22
Probe31
Probe37
Probe38
Probe36
Probe27
Probe34
Probe18
Probe16
Probe30
Probe21
Probe26
Probe33
Probe32
Probe19
Probe40
Probe20
Probe28
Probe17
Probe24
Probe25
Probe29
Probe35
Probe23
Probe39
Probe3
Probe11
Probe5
Probe9
Probe2
Probe6
Probe1
Probe4
Probe10
Probe15
Probe8
Probe12
Probe13
Probe7
Probe14
0
10
20
30
Dose
TreatmentB
TreatmentA
Control
Treatment
Sit
Sit
Sit
Sit
Site2
Sit
Sit
Site3
Sit
Site3
Site2
Site3
Site1
Site
Ty
Pr
Ty
Ph
Pr
Ty
Ki
Ph
Pr
Ot
Pro
Ph
Ty
Ki
Oth
Ph
Ty
Ki
Ot
Ki
Ot
Ph
Ki
Ph
Pr
Ot
Ki
Ty
Pro
Ki
Oth
Ph
Ty
Ph
Ty
Ki
Type
1
2
3
4
Sens
4.5
5
5.5
6
6.5
7
7.5
8
8.5
S
e
p
a
l
.
L
e
n
g
t
h
1.5
2.25
3
3.75
4.5
5.25
6
6.75
7.5
P
e
t
a
l
.
L
e
n
g
t
h
2.25
2
1.75
1.5
1.25
1
0.75
0.5
0.25
P
e
t
a
l
.
W
i
d
t
h
Species
setosa
versicolor
virginica
Iris Data Set
logFC
-3
-2
-1
0
1
2
AveExpr
-1
-0.5
0
0.5
1
1.5
Group
Decreased
Increased
NoChange
FC
0
1
2
3
Profile plot
Variable1
Variable2
Variable3
Sample1
Sample2
Sample3
Sample4
Sample14
Sample19
Sample7
Sample9
Sample8
Sample20
Sample13
Sample17
Sample11
Sample10
Sample15
Sample16
Sample12
Sample6
Sample5
Sample18
0
5
10
Altered
Deleted
Amplified
6
7
8
9
Mutated
Amplification
Deletion
Mutation
Gene1
Gene2
Gene3
Receptor Gene4
Gene5
Gene7
Gene
Activate
Cool Pathway
exp1
exp2
exp3
Gene1
Gene2
Gene3
Receptor Gene4
Gene5
Gene7
Gene
Activate
Cool Pathway
exp1
exp2
exp3