Note: bioInfograph is fully tested in Chrome browser that provides the best experience.
Cite: K. Li, J. Hurt, C.D. Whelan, R. Challa, D. Lin, and B. Zhang. bioInfograph: an online tool to design and display multi-panel scientific figure interactively. Frontiers in Genetics, 2021:fgene.2021.784531.Usage of bioInfograph
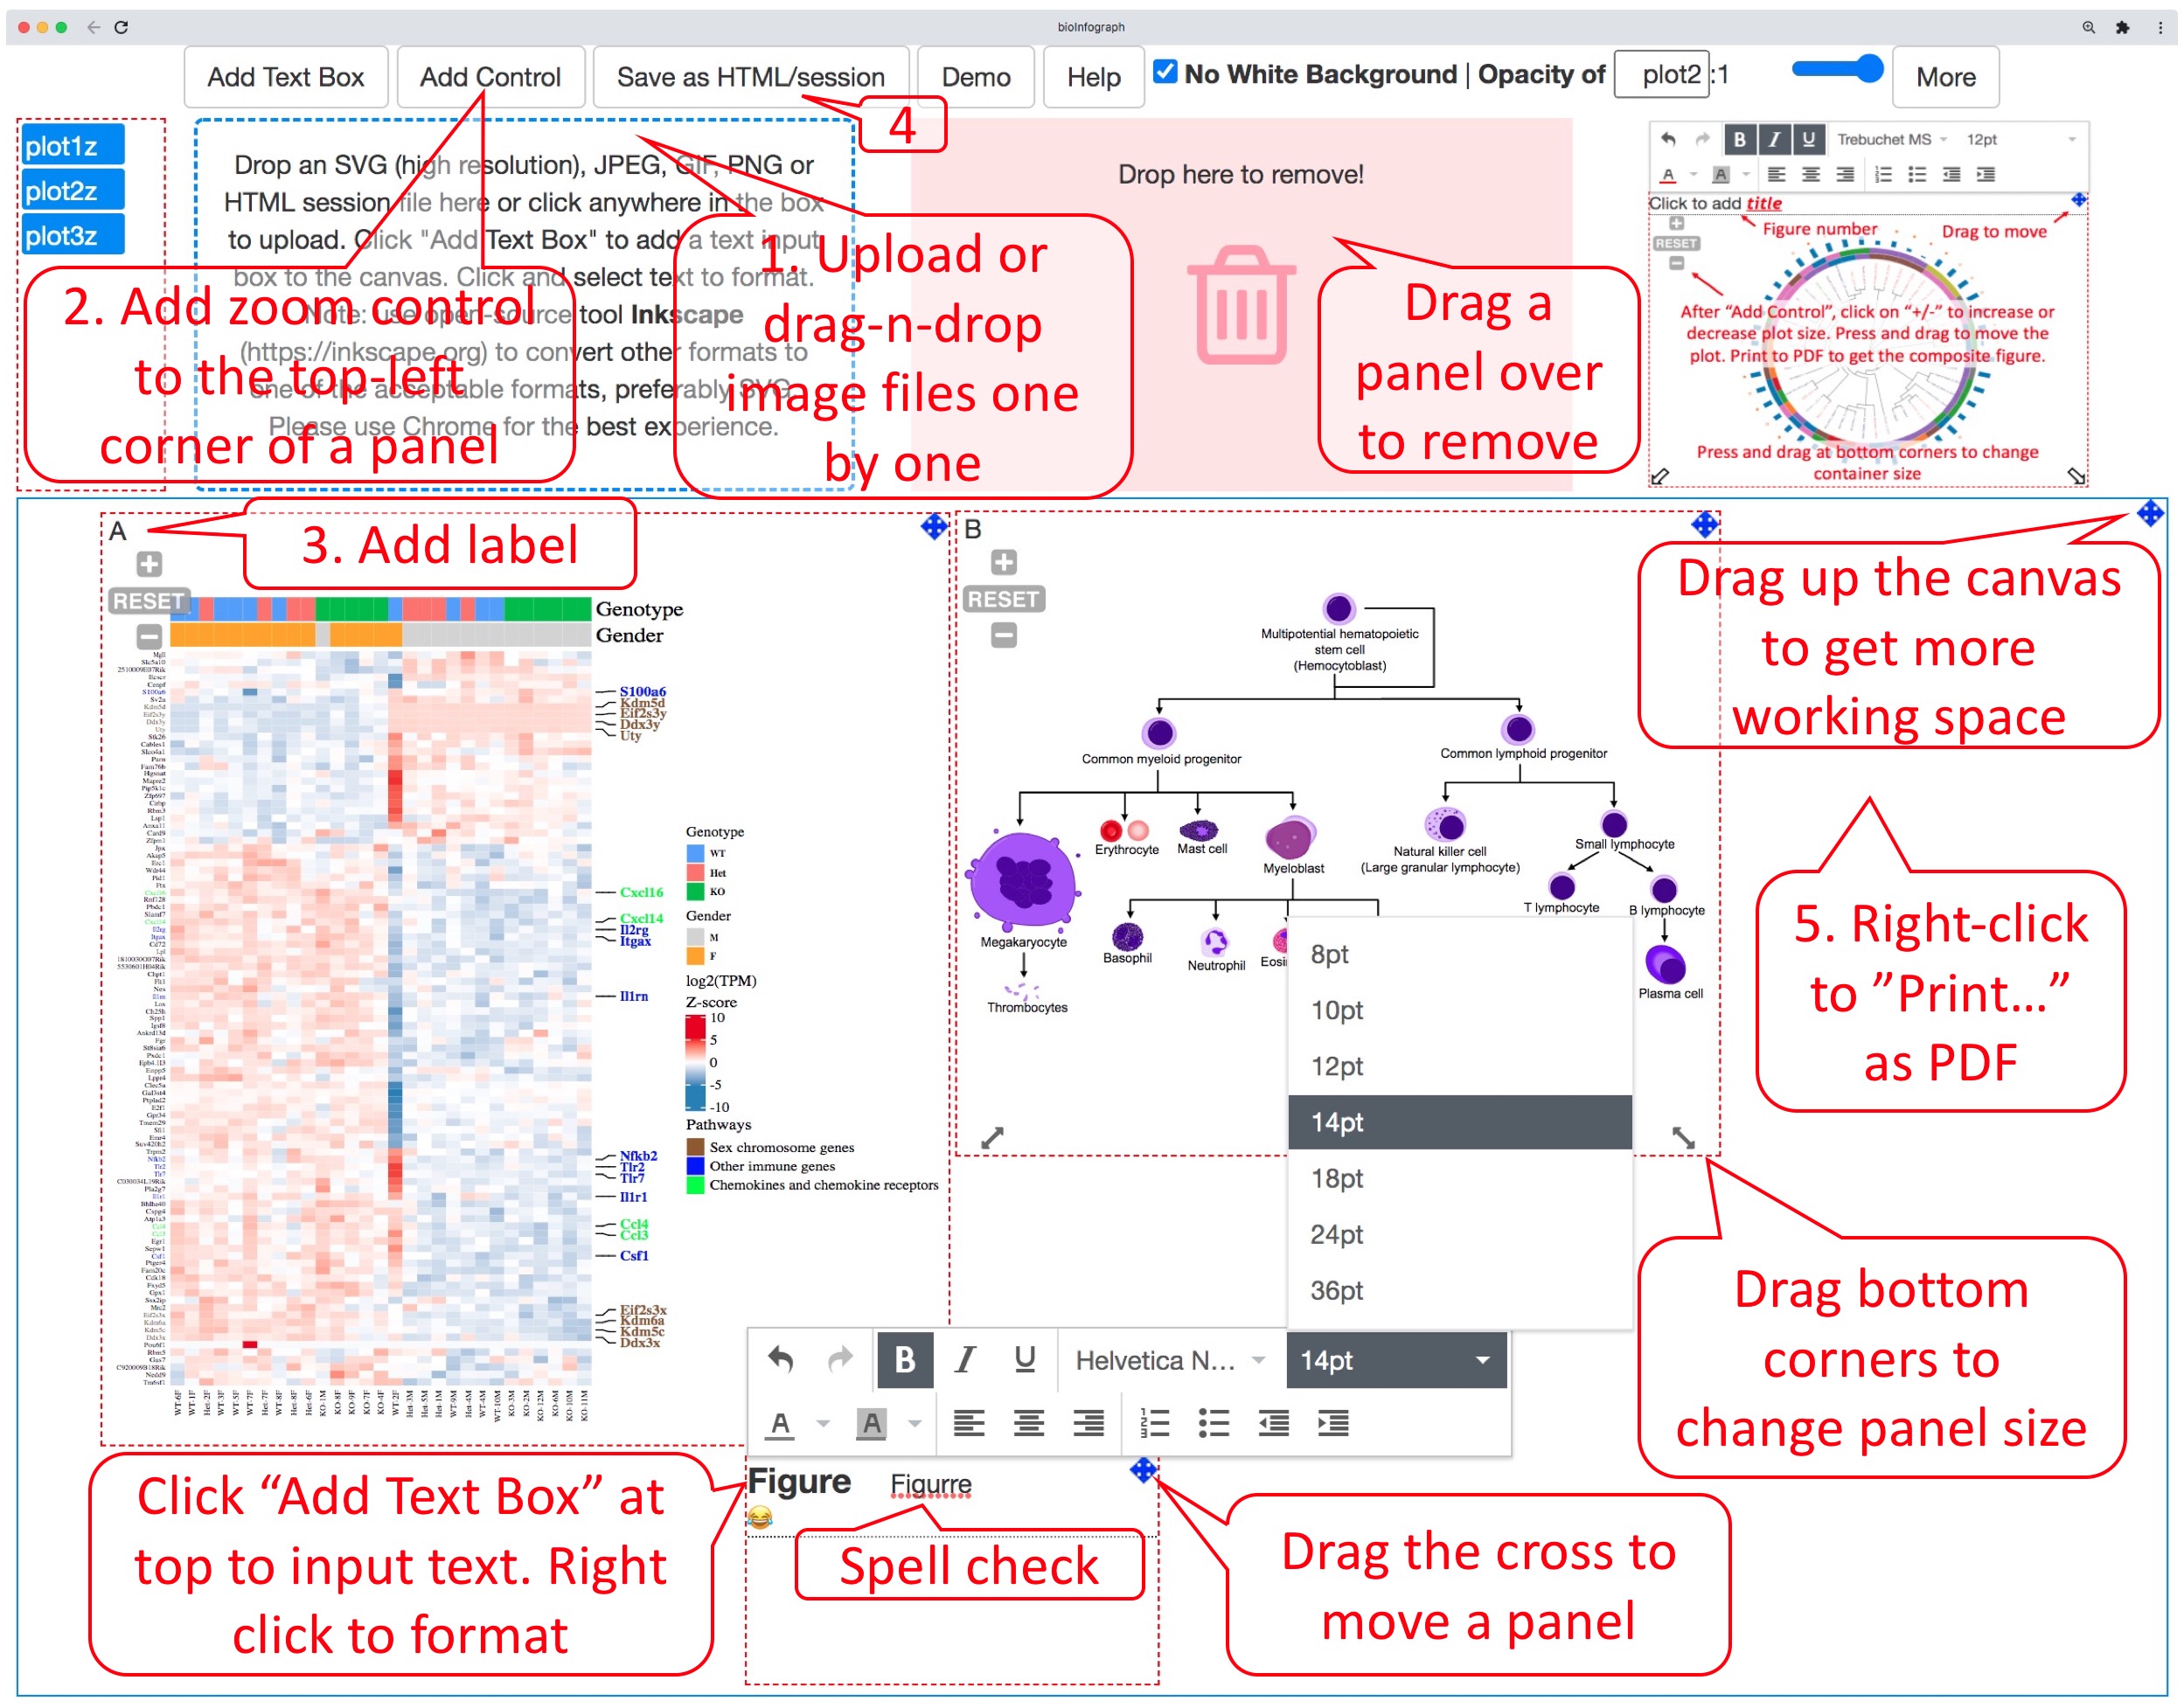
bioInfograph allows user to easily arrange multiple plots in SVG, png, jpeg, or gif format exported by other tools. Each individual plot can be adjusted in size and placed freely on the canvas. A minimal workflow is outlined by numbered callout boxes in red while important features not required by the minimal workflow are briefed in un-numbered boxes.
Text input
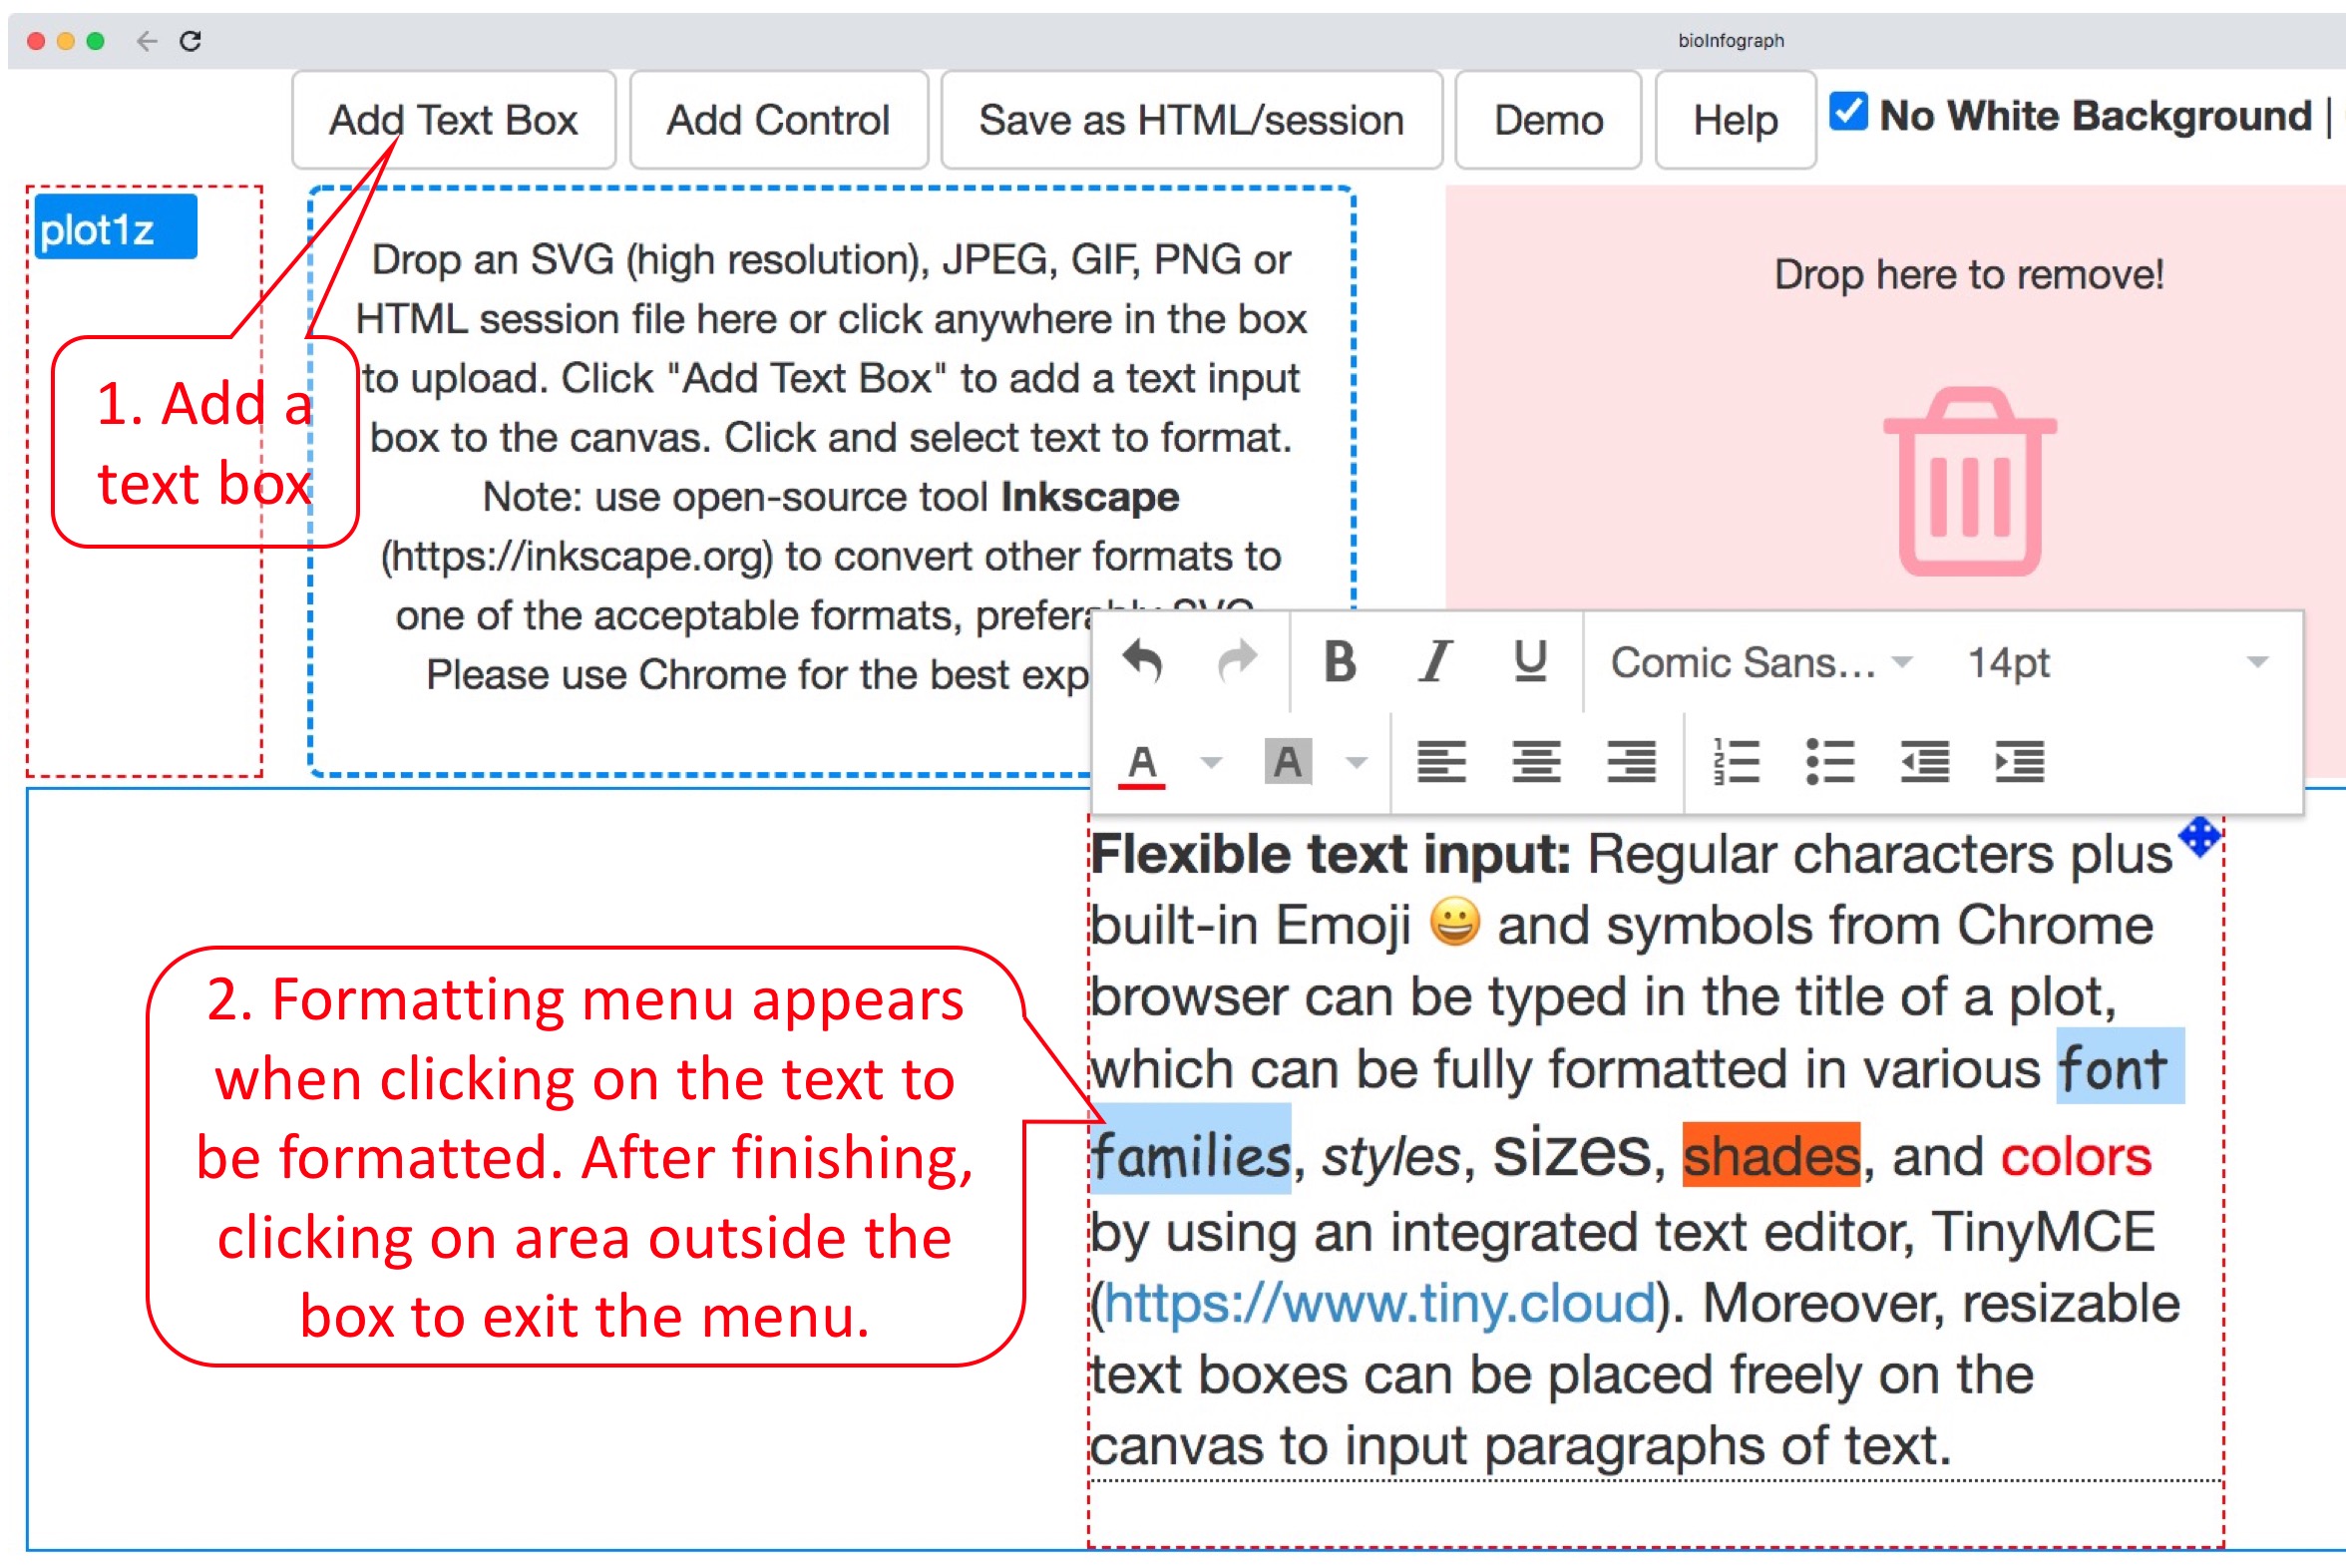
Input of paragraphs of text by clicking on “Add Text Box” and then typing in the resizable box that was added to the canvas a moment ago. Clicking on text will fire up the formatting menu while clicking on any area outside the box will exit the menu. Formatting is always applied to selected text.
Change the vertical stacking order of plots
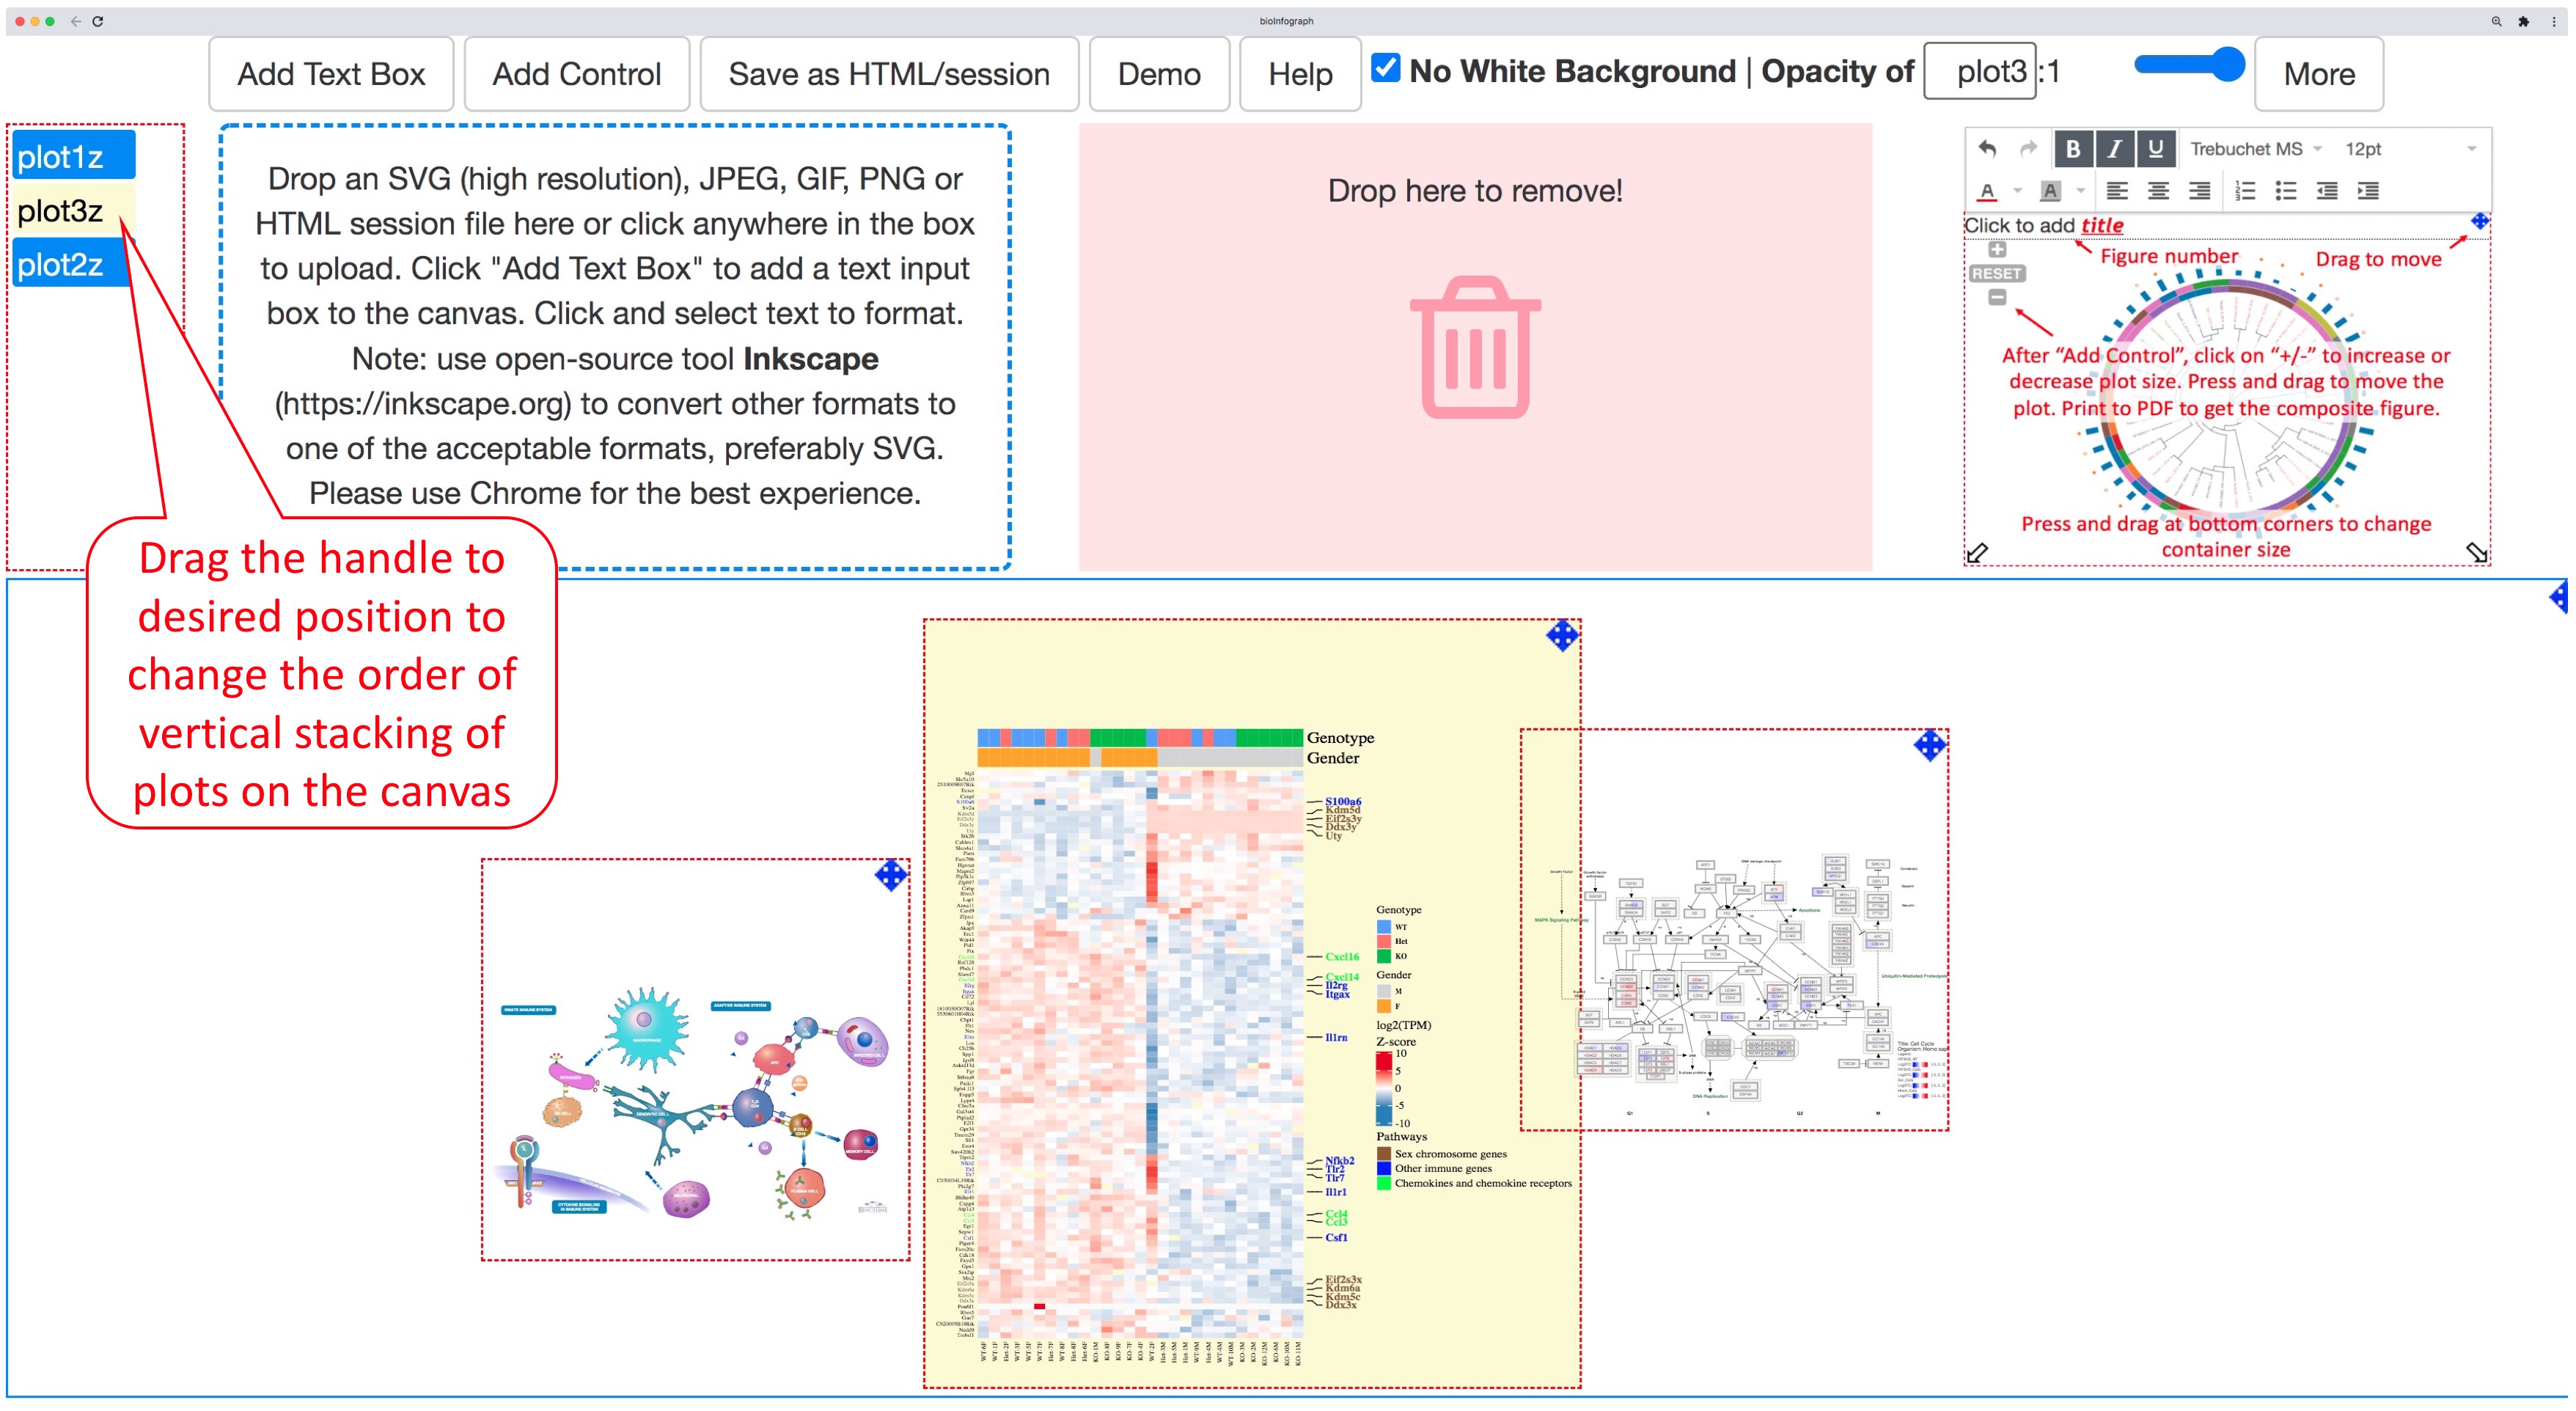
Each plot will get a button handle when it is loaded onto the canvas. A plot and the linked handle will be highlighted in yellow when hovering mouse over a handle. Dragging the handle and dropping it at desired position among these buttons will change the relative vertical stacking, also known as z-index of the plot. The bottom position represents the top layer of the stack of plots on the canvas.
Overlaying plots
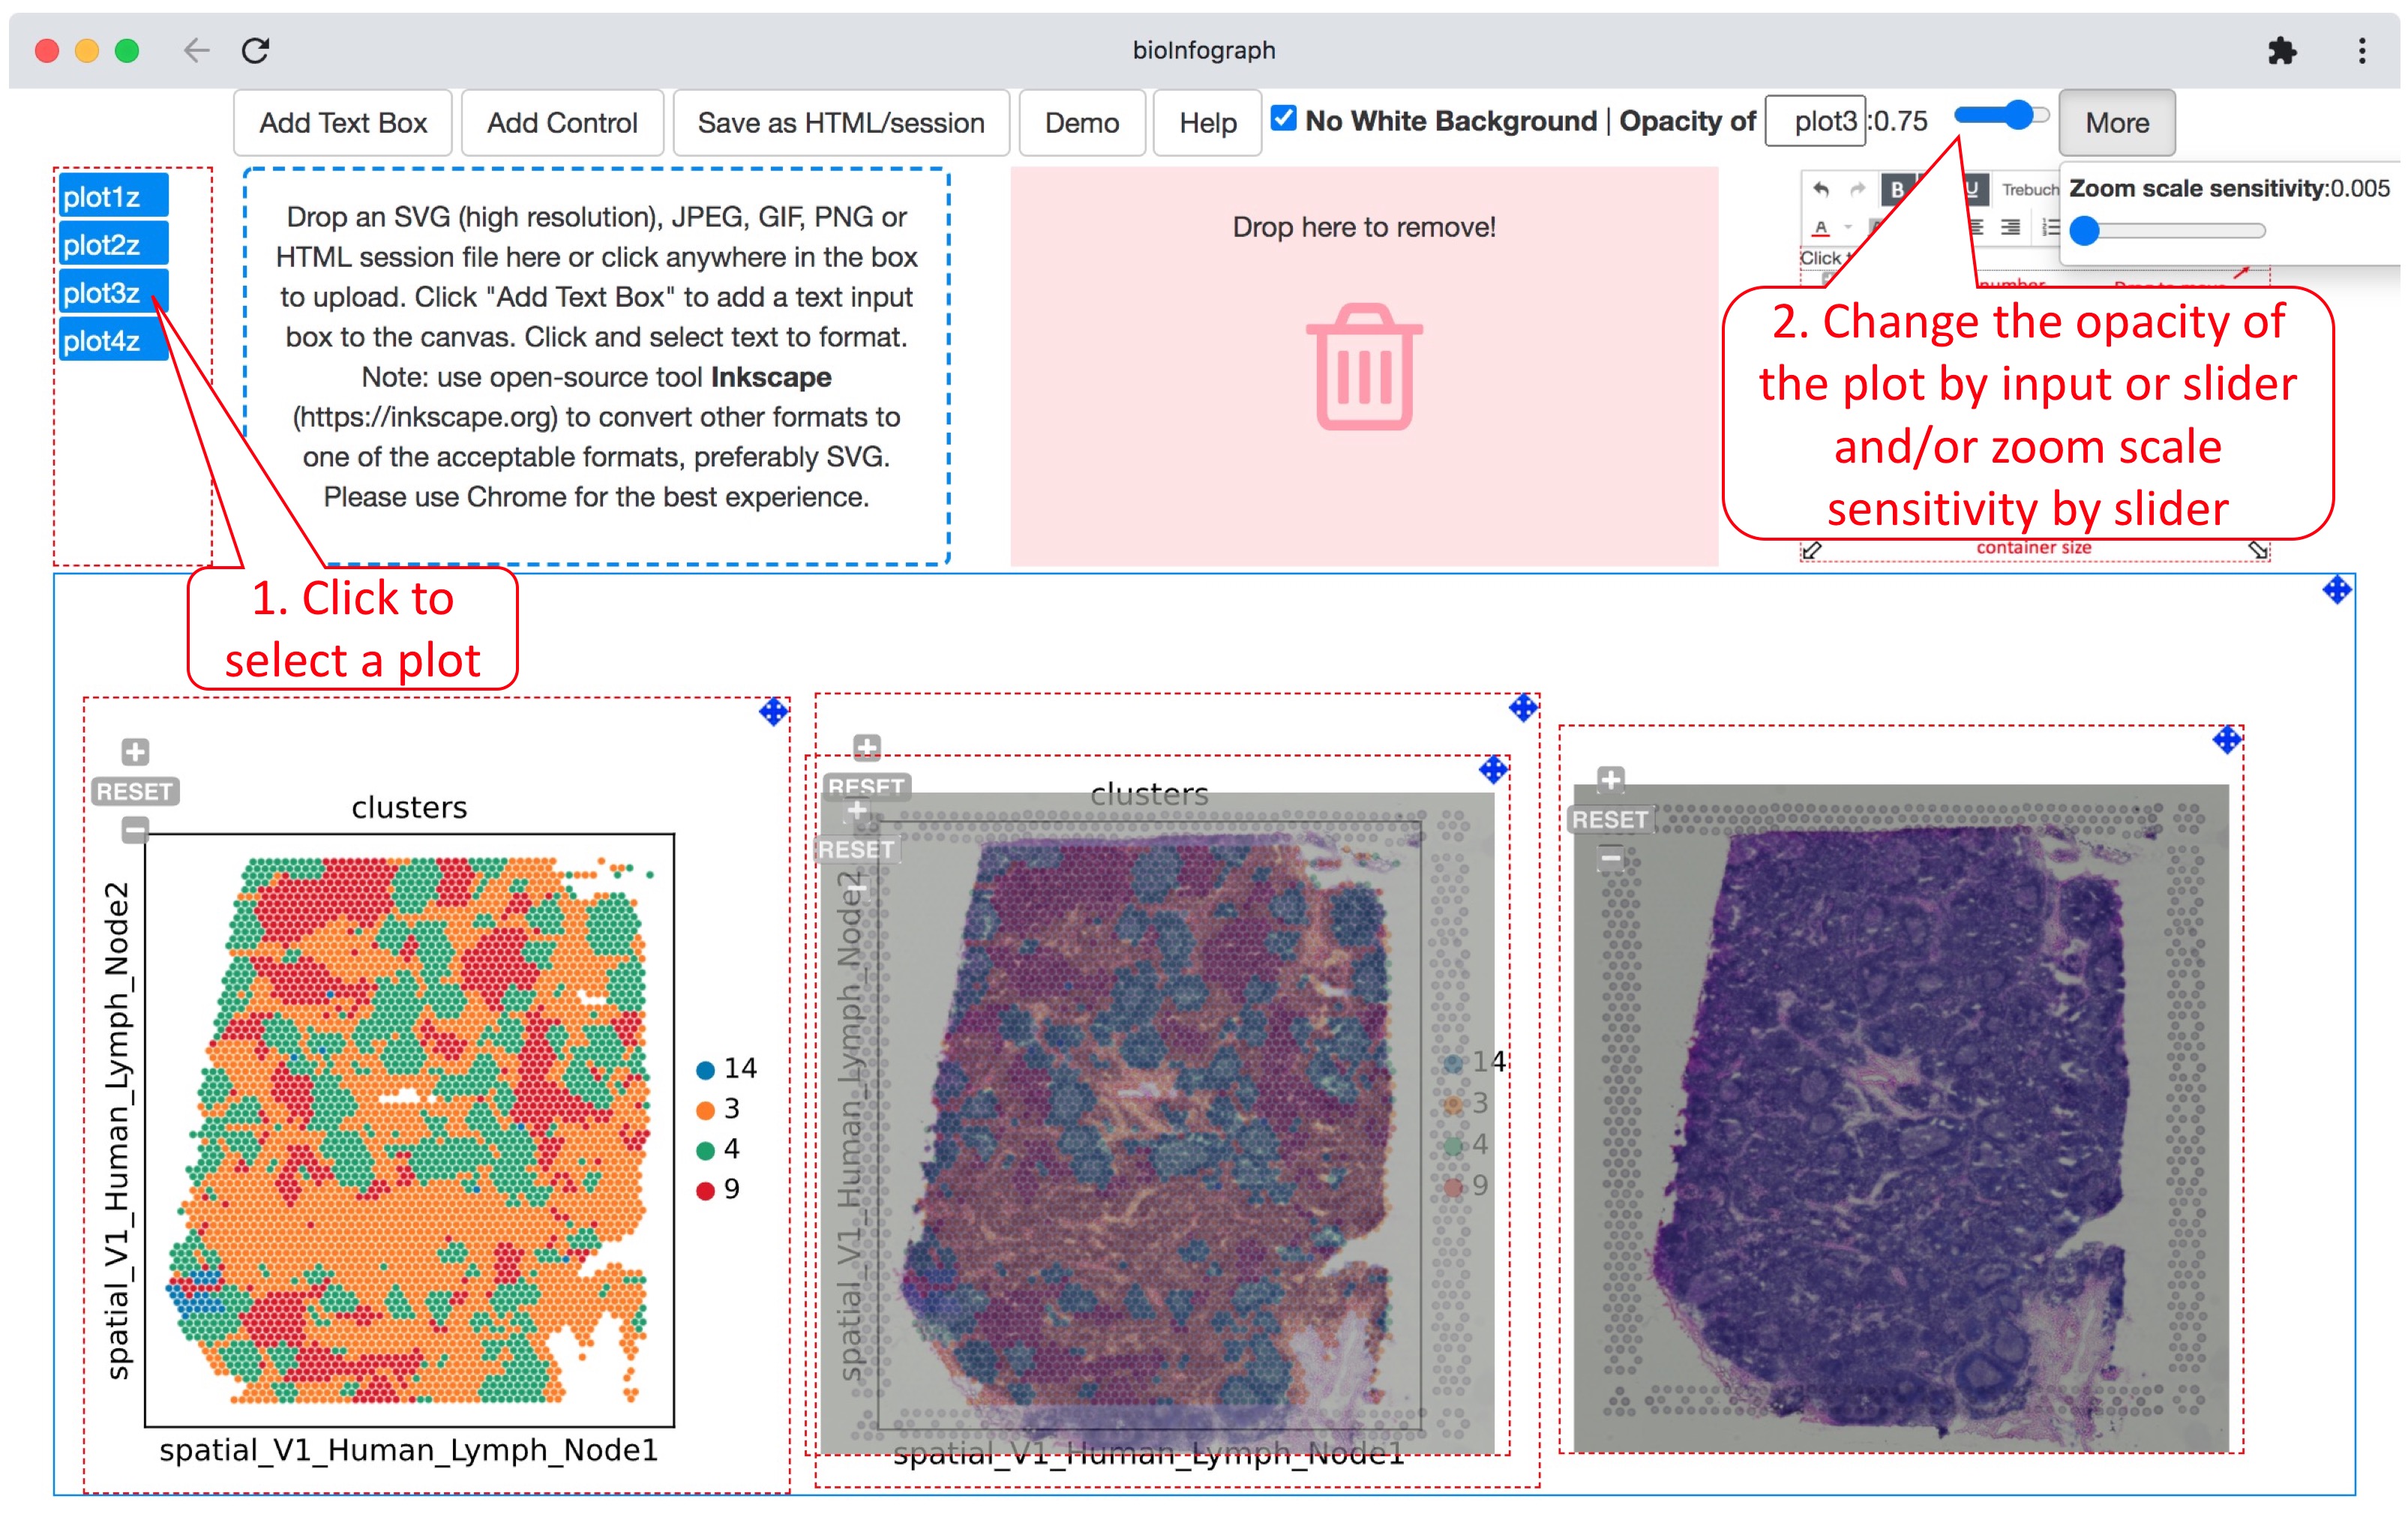
Overlaying colored spatial clustering plot and histological image to illustrate the relationship of histological features and clusters based on 10X Genomics spatial transcriptomics data. User can adjust the opacity of a selected plot by clicking a plot handle to select the plot and then typing a number or using the slide to change the value. The zoom scale sensitivity of the plot is tuned to the smallest number for fine alignment of overlaid plots.
Zoom in and link out features
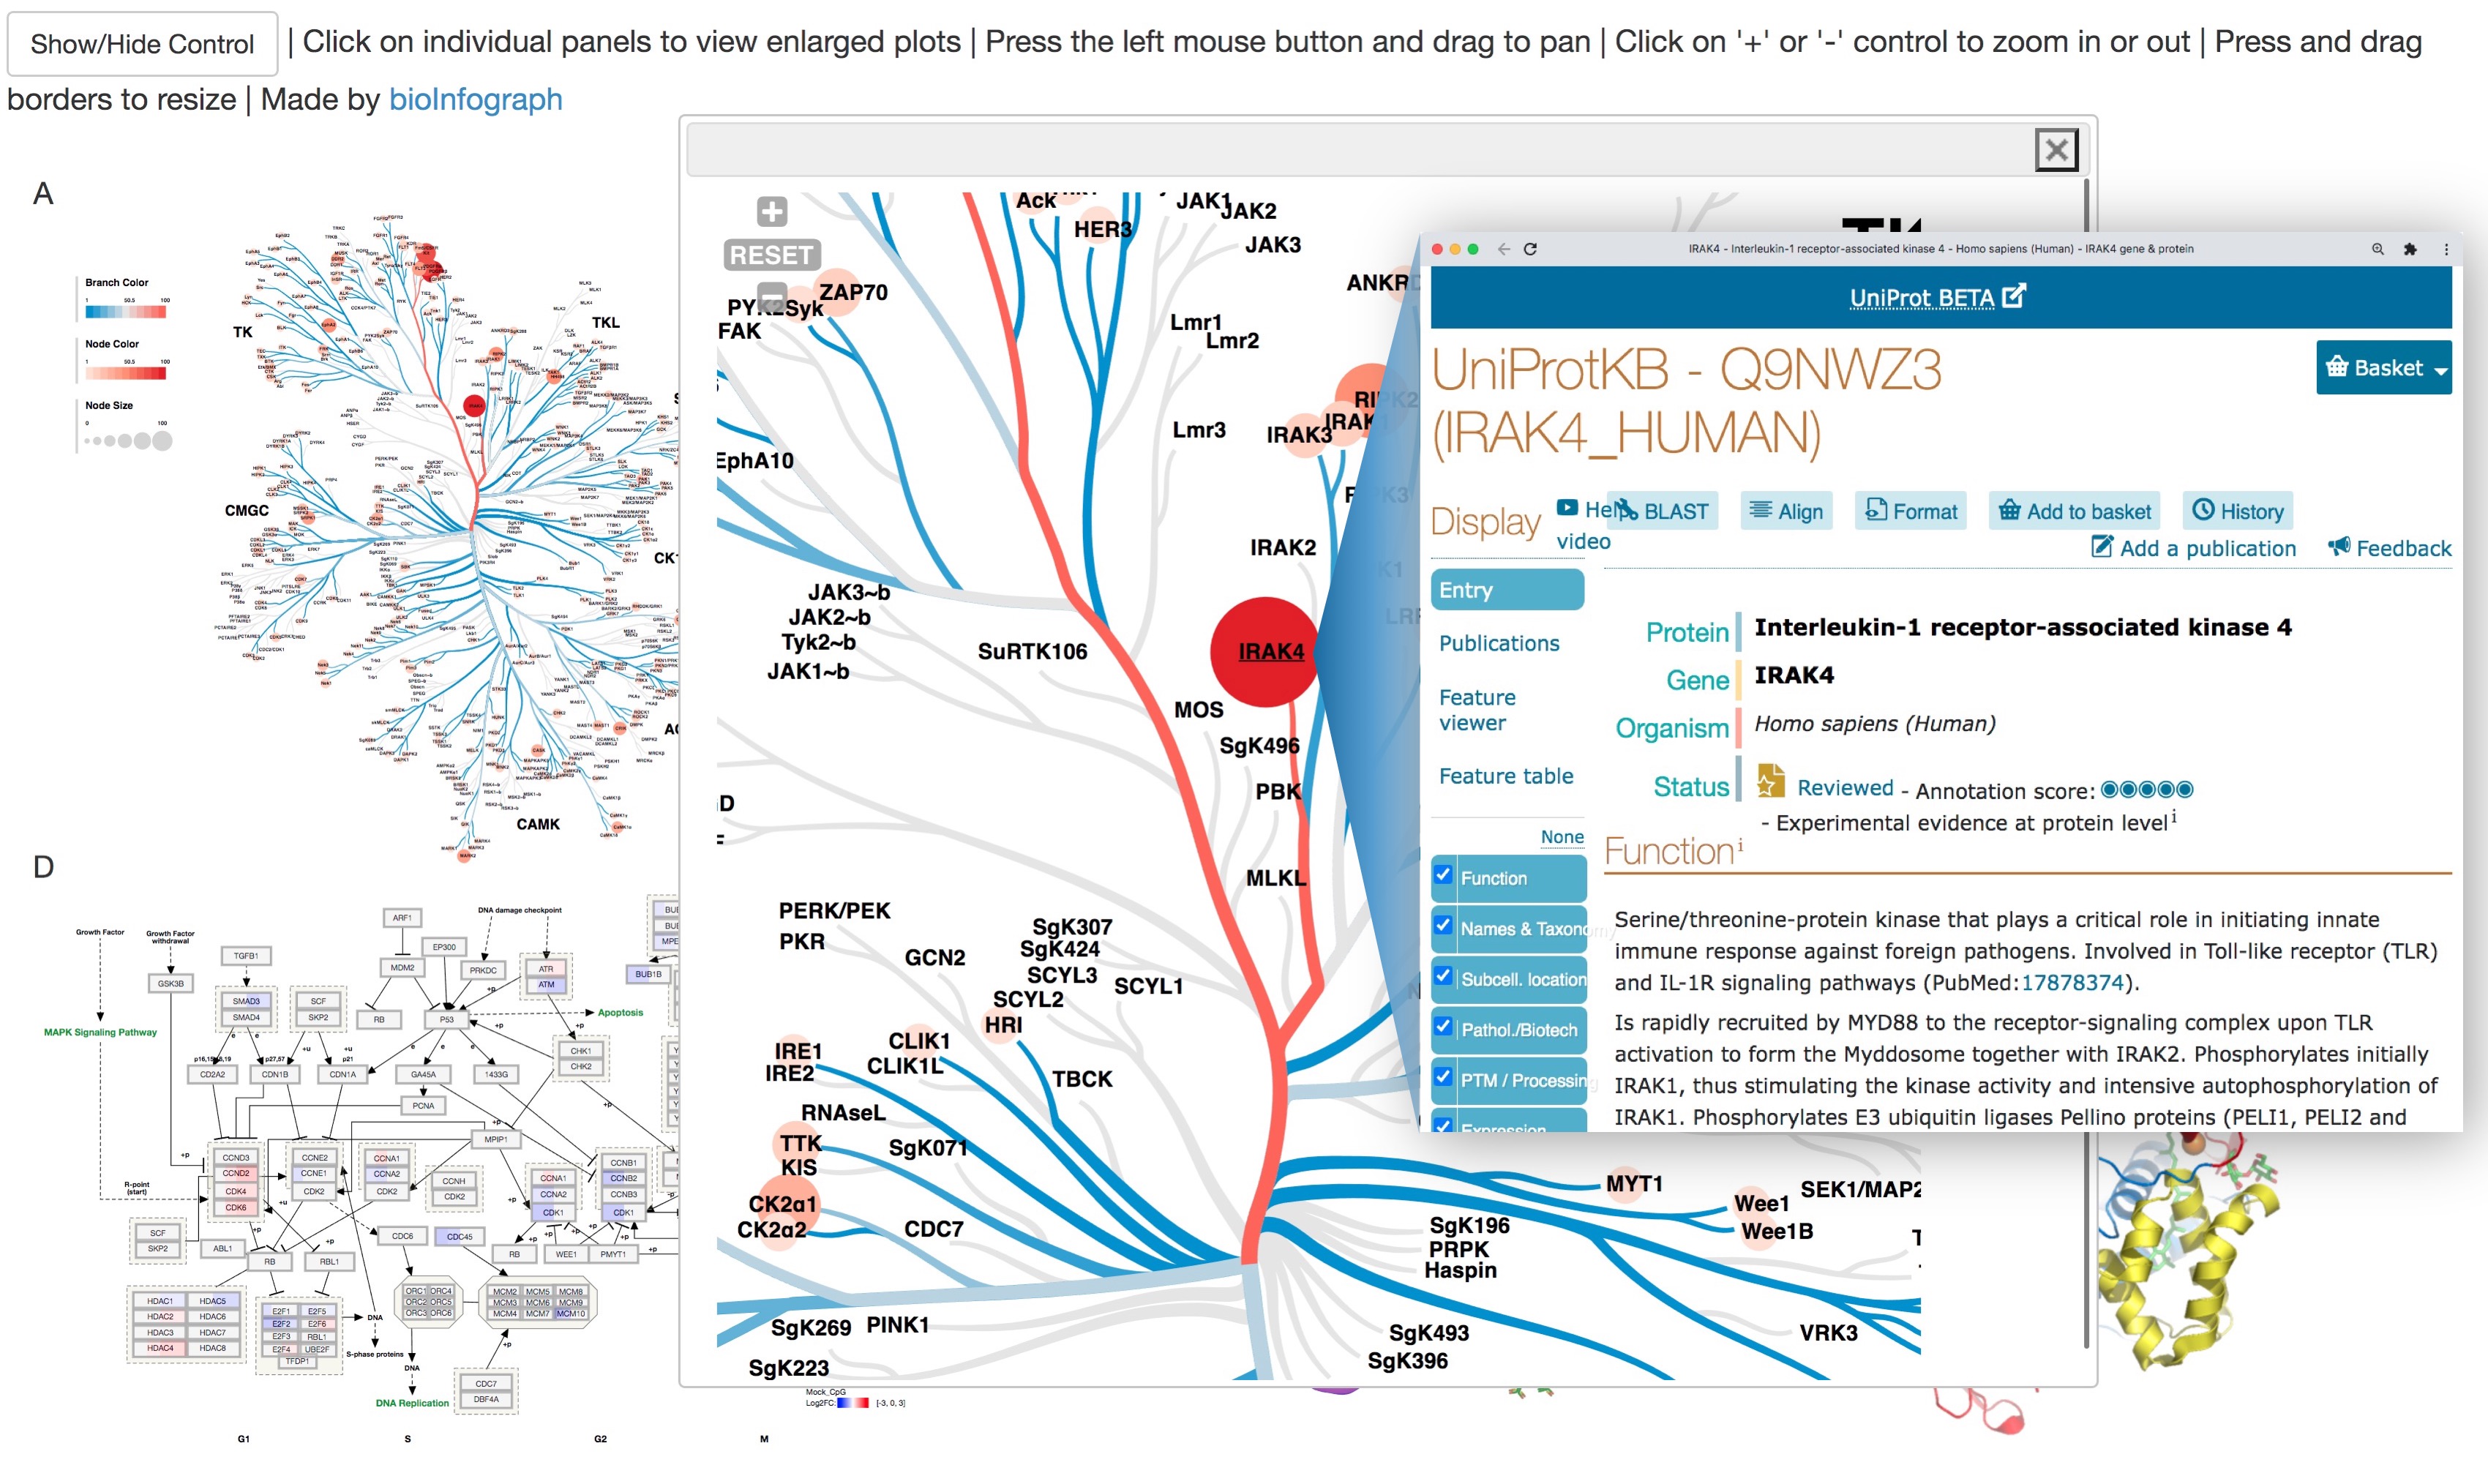
Interactive online HTML presentation of Figure 1 with zoom in and link out features. Clicking on an individual plot will bring up a popup window with the enlarged zoomable version. Links in SVG are active, so clicking on “IRAK4” on the node in the phylogenetic tree will show detailed information about the protein in UniProt database.
