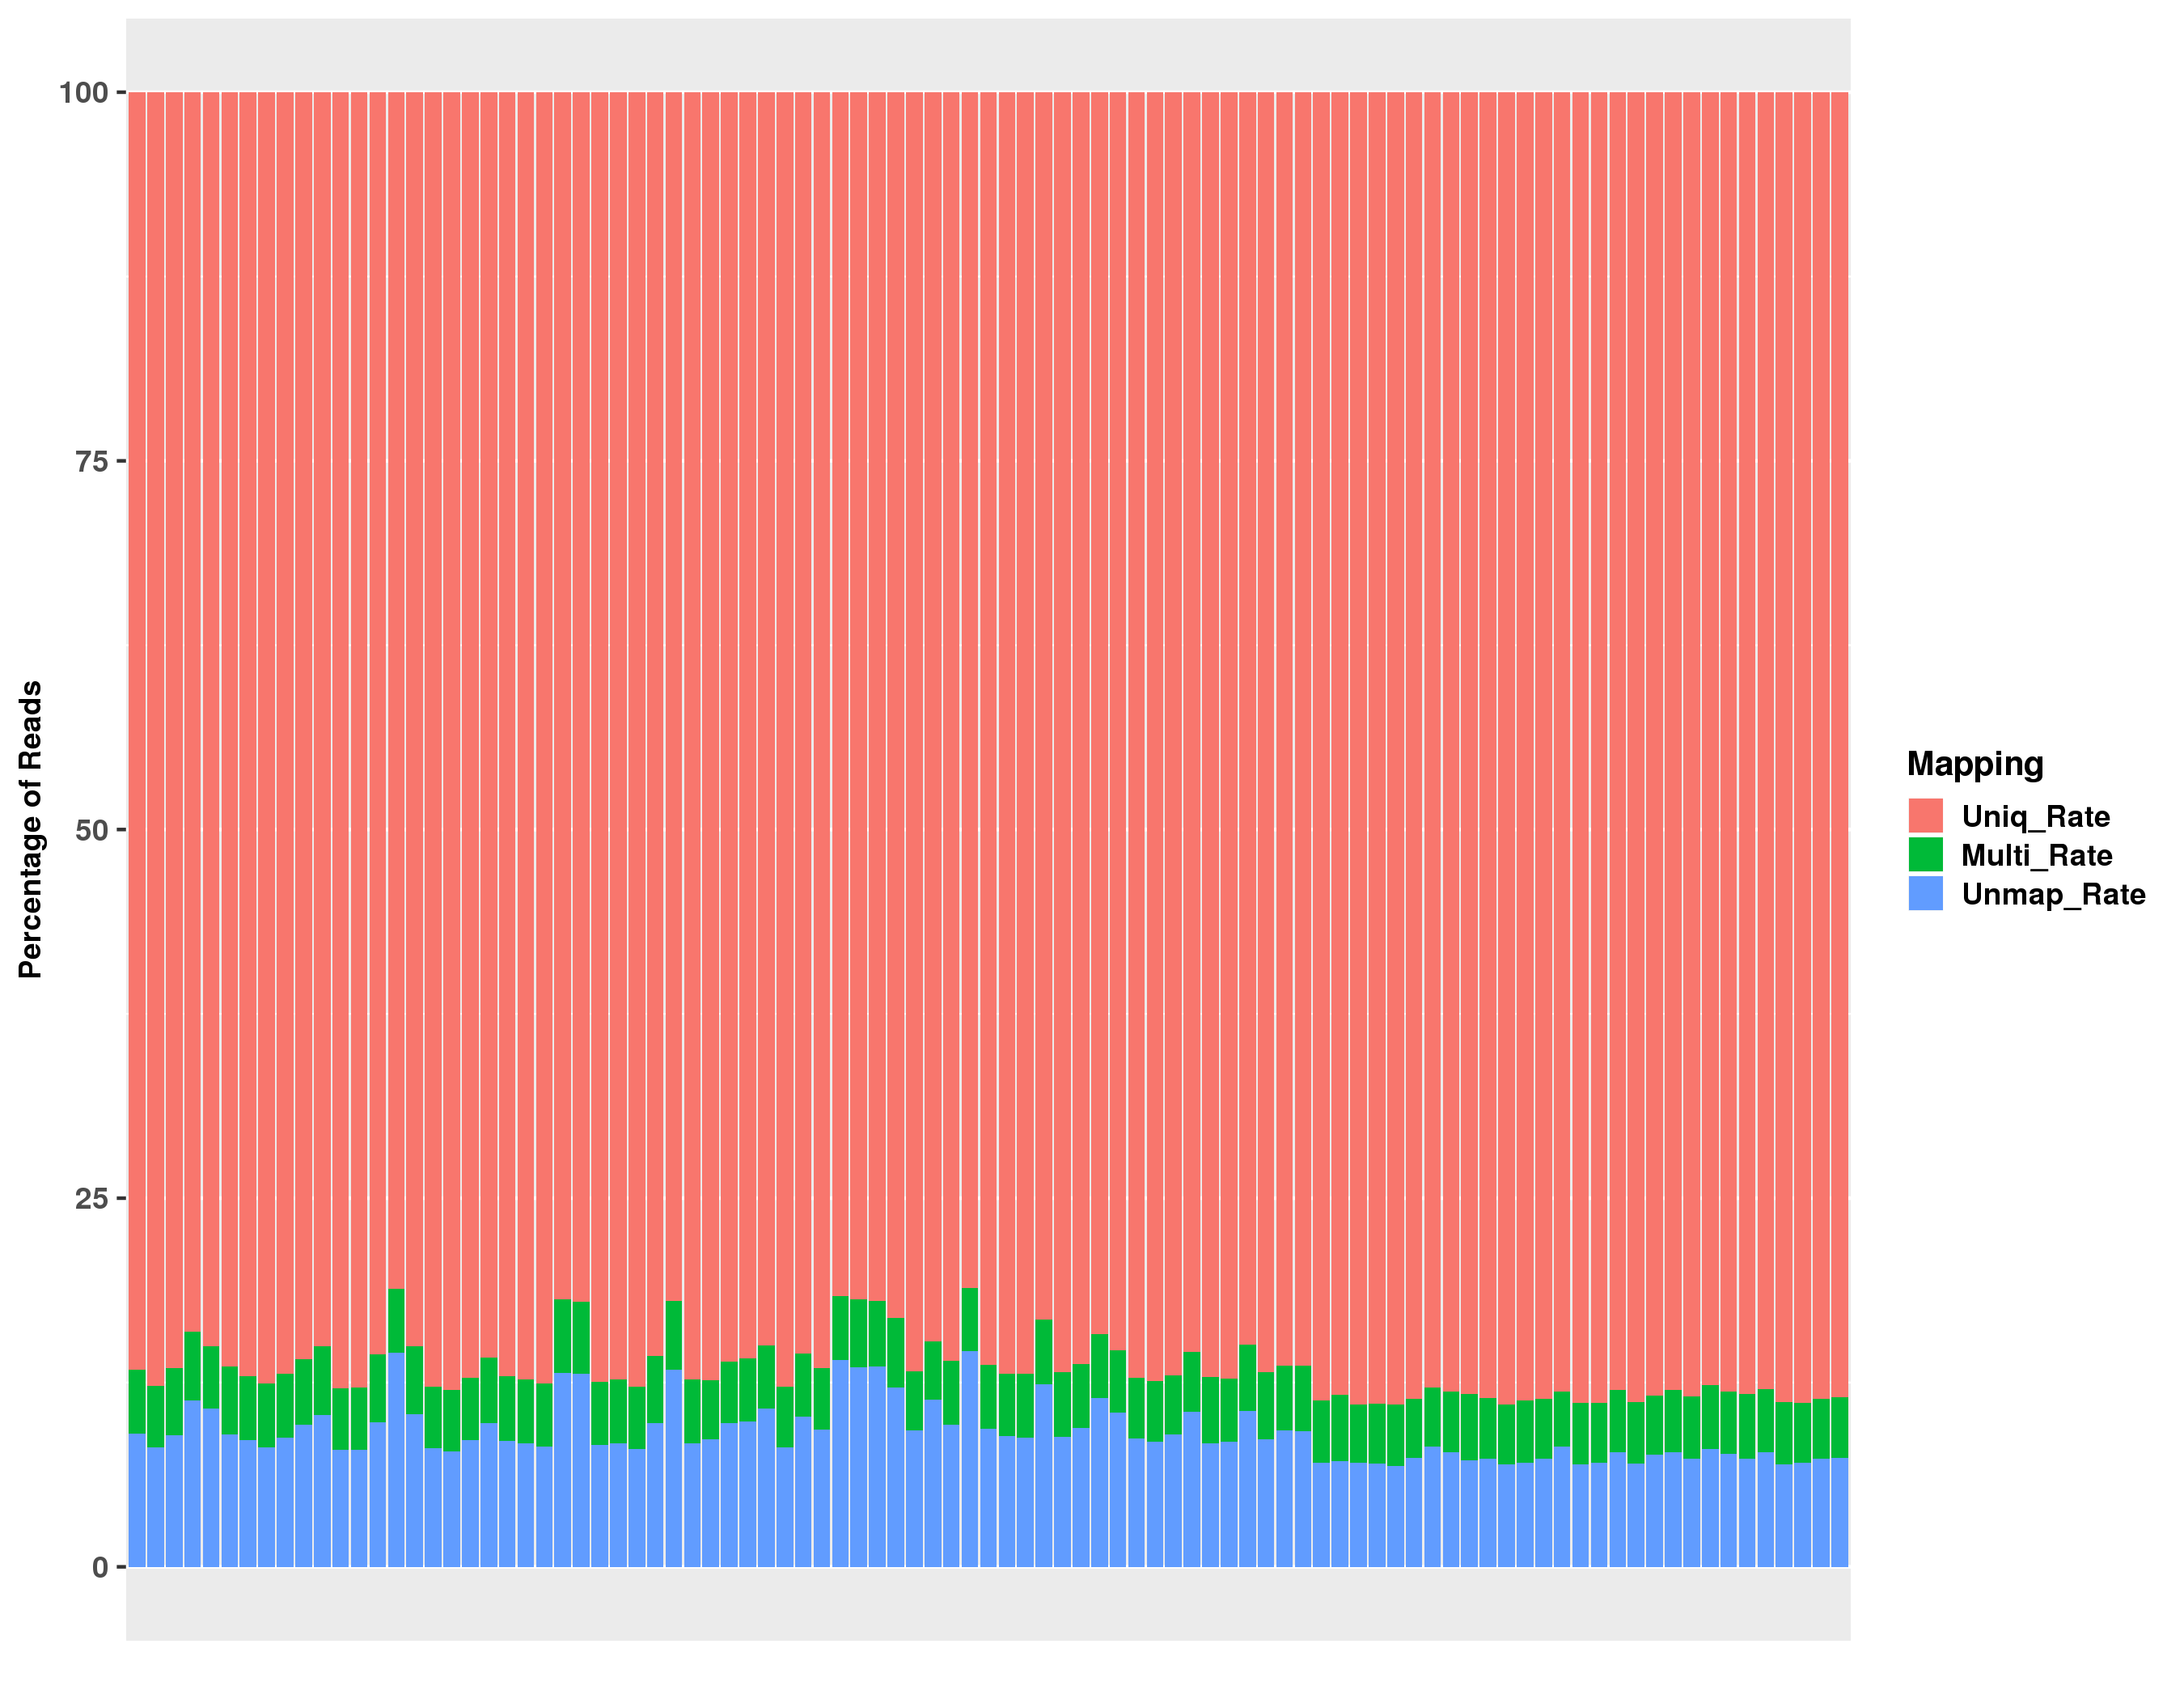
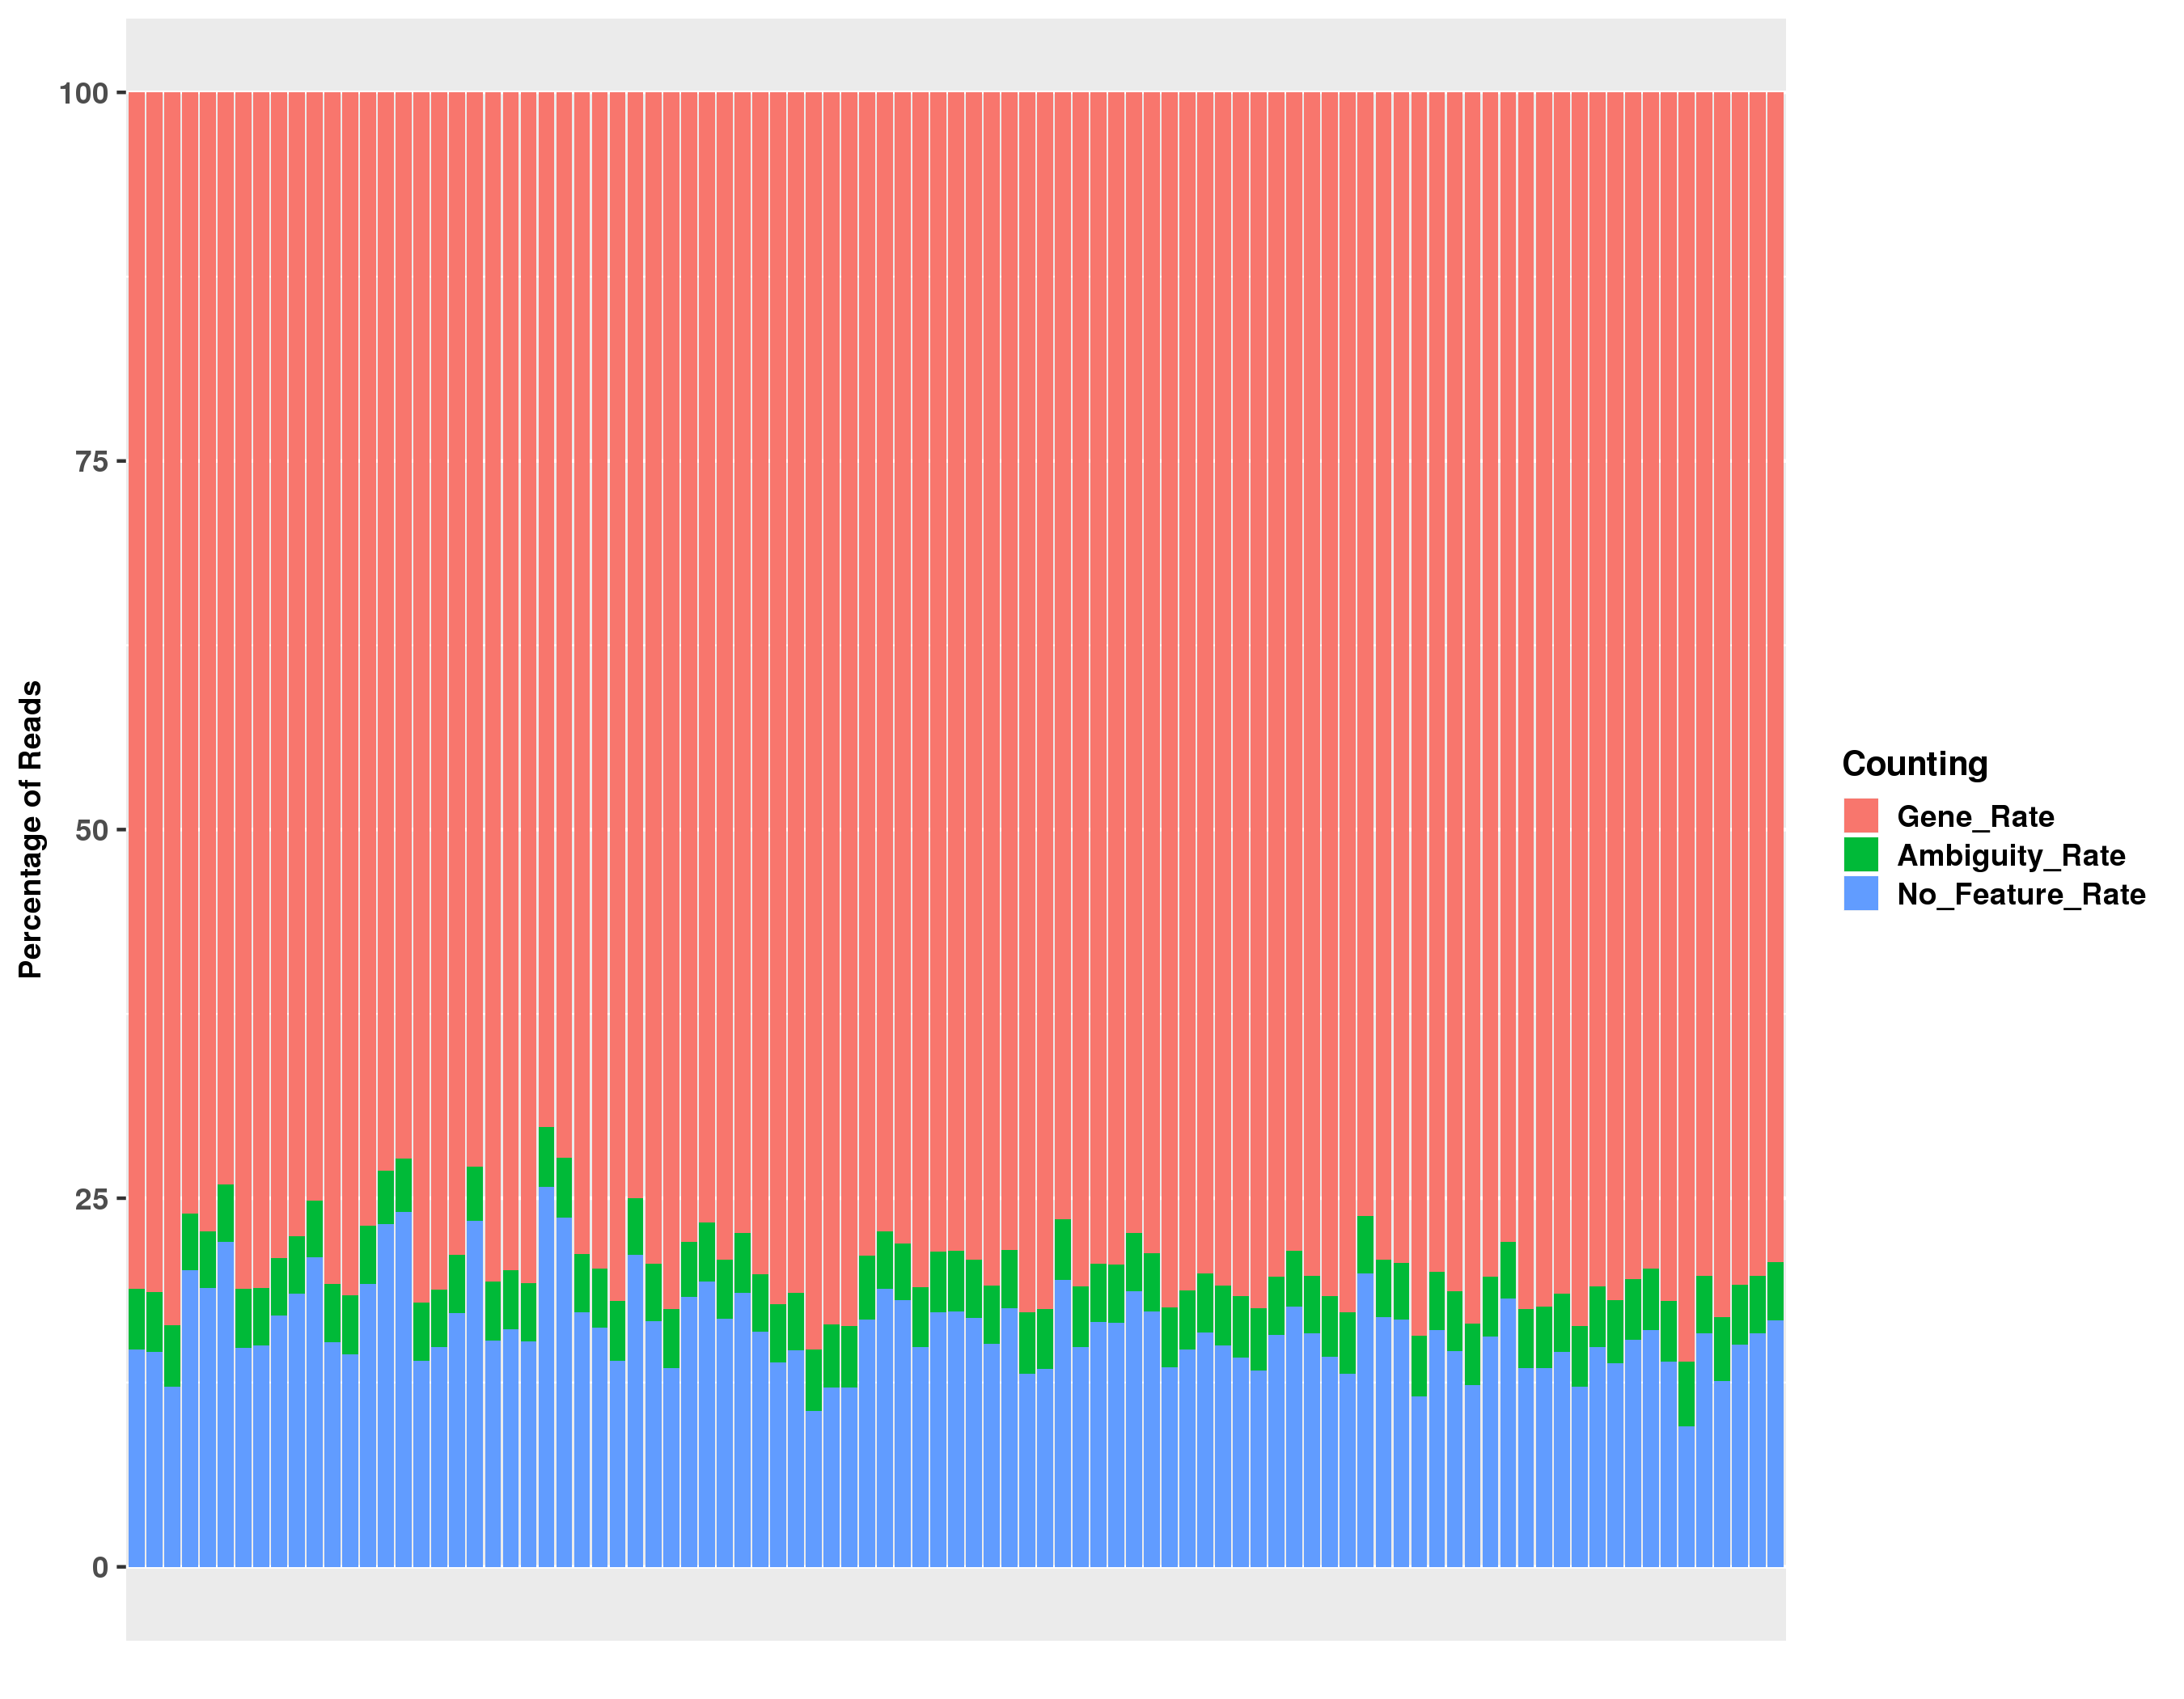
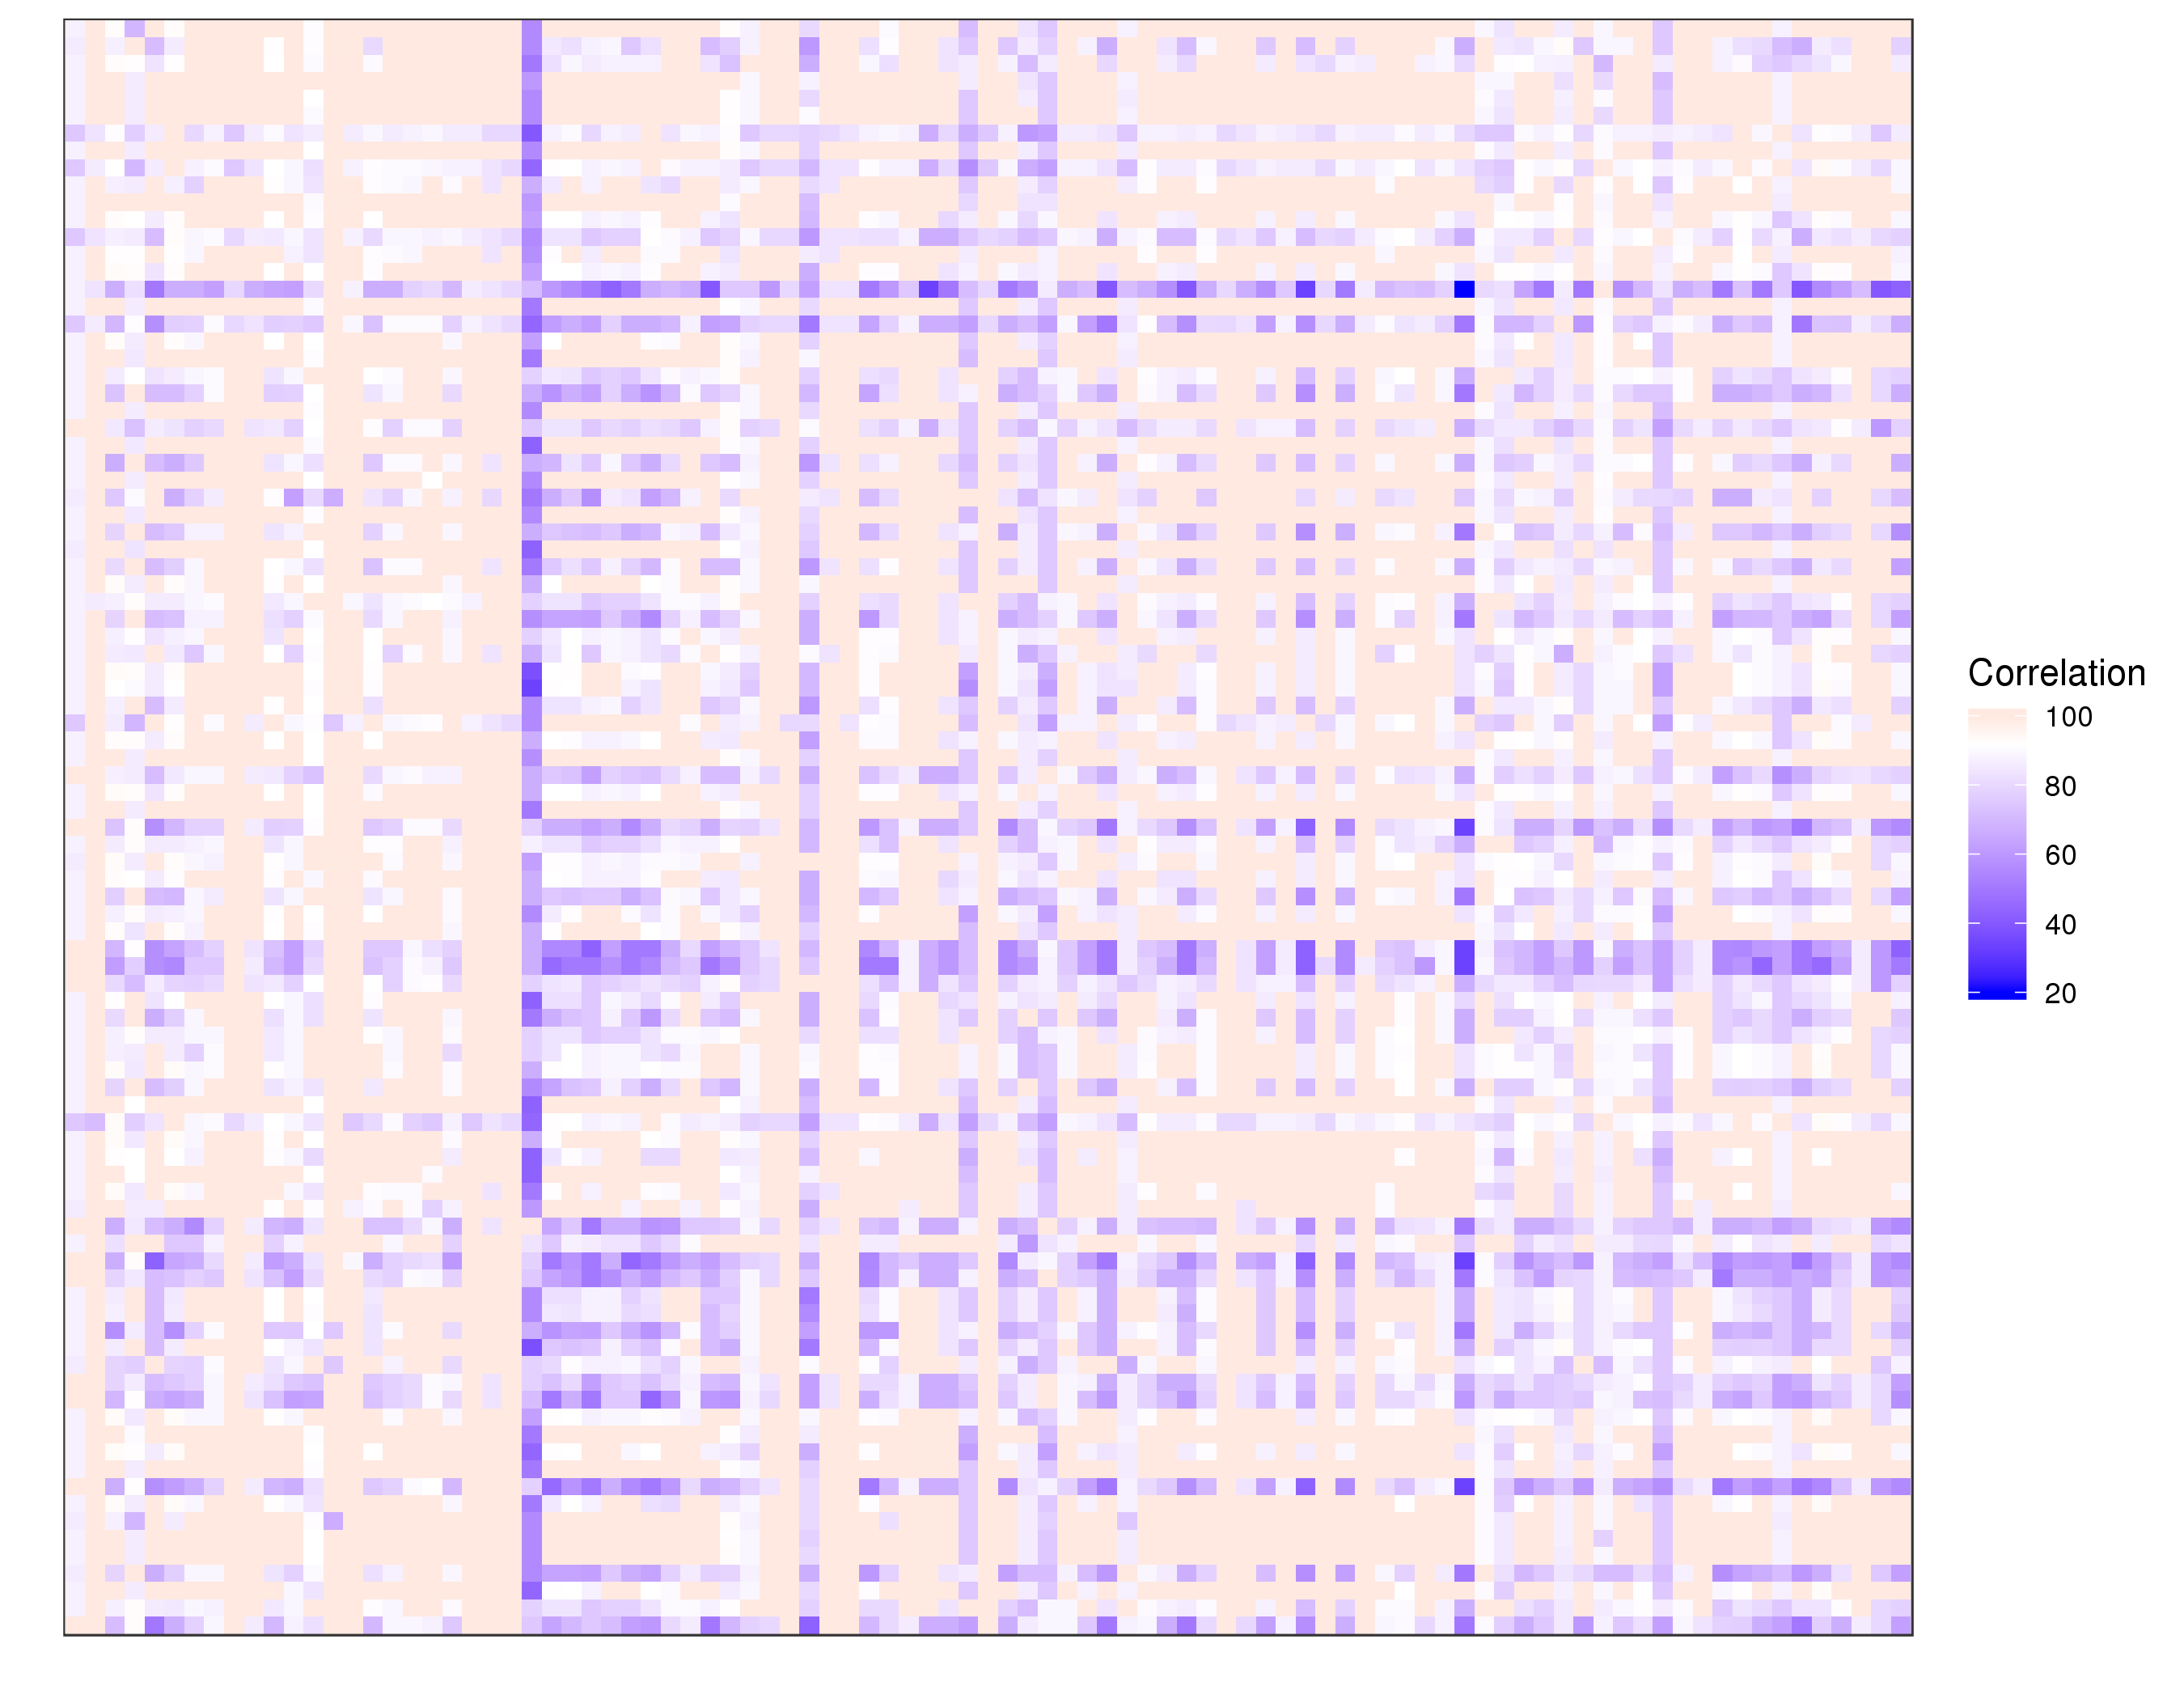
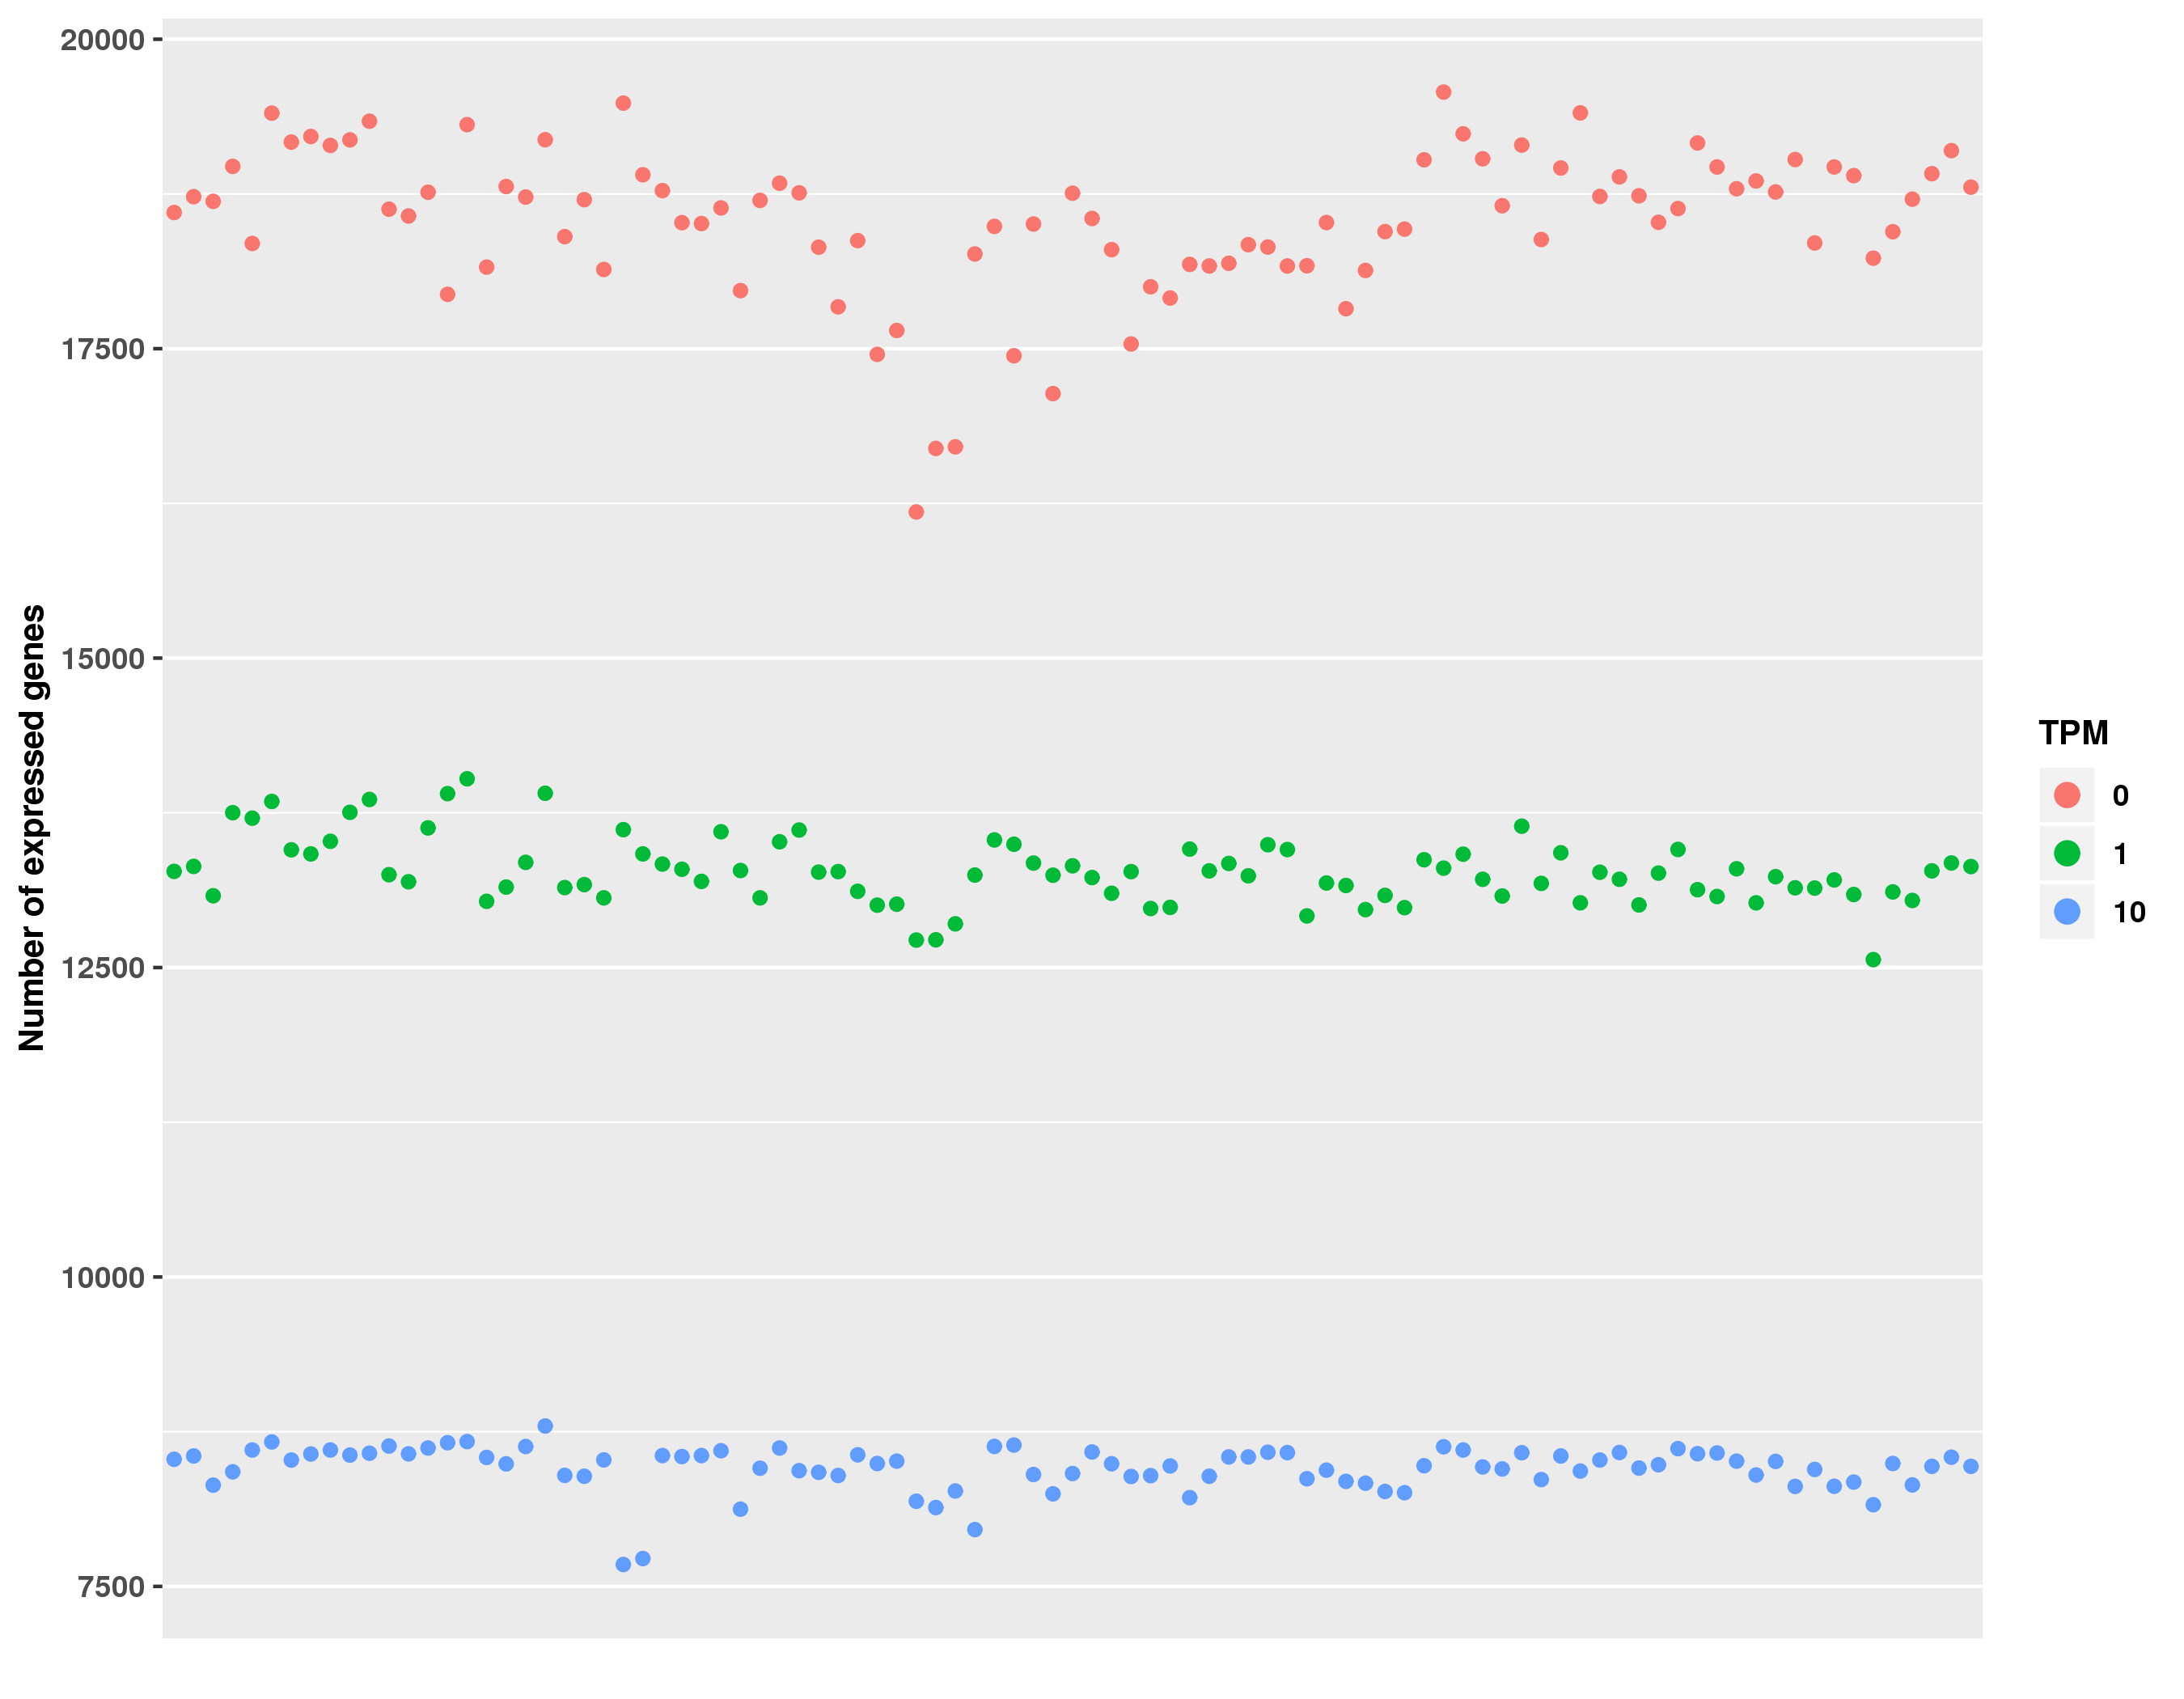
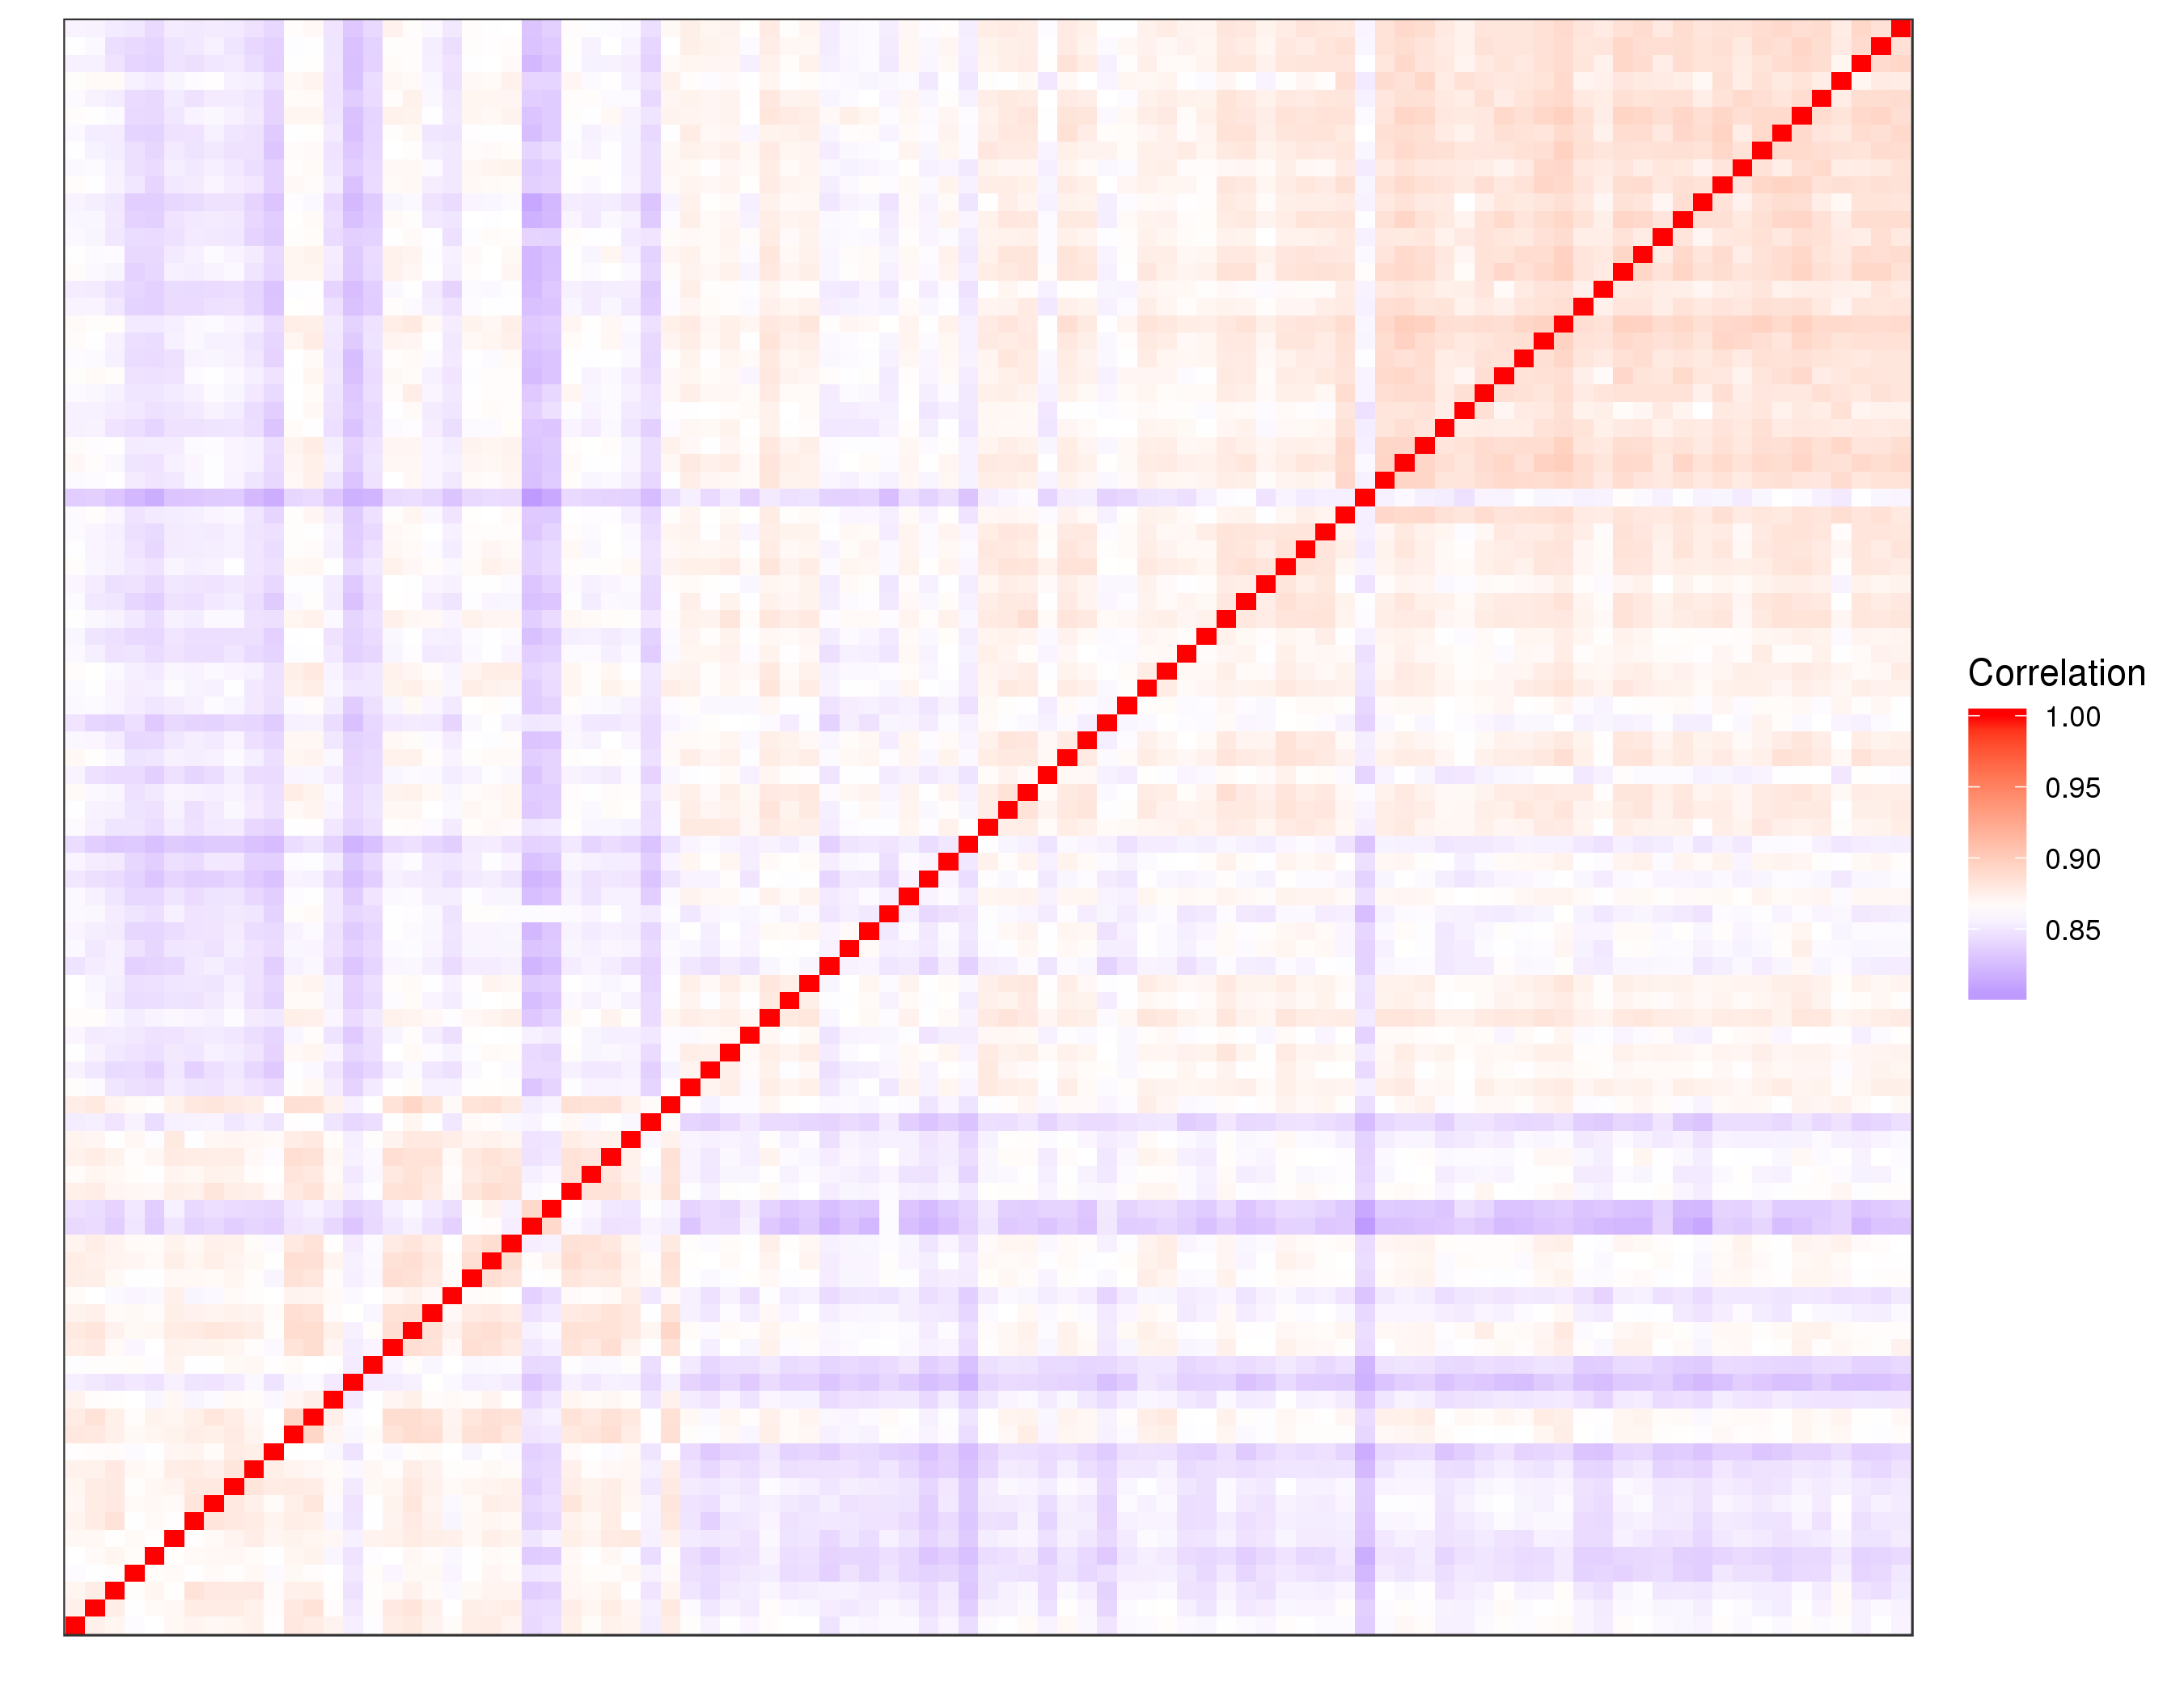
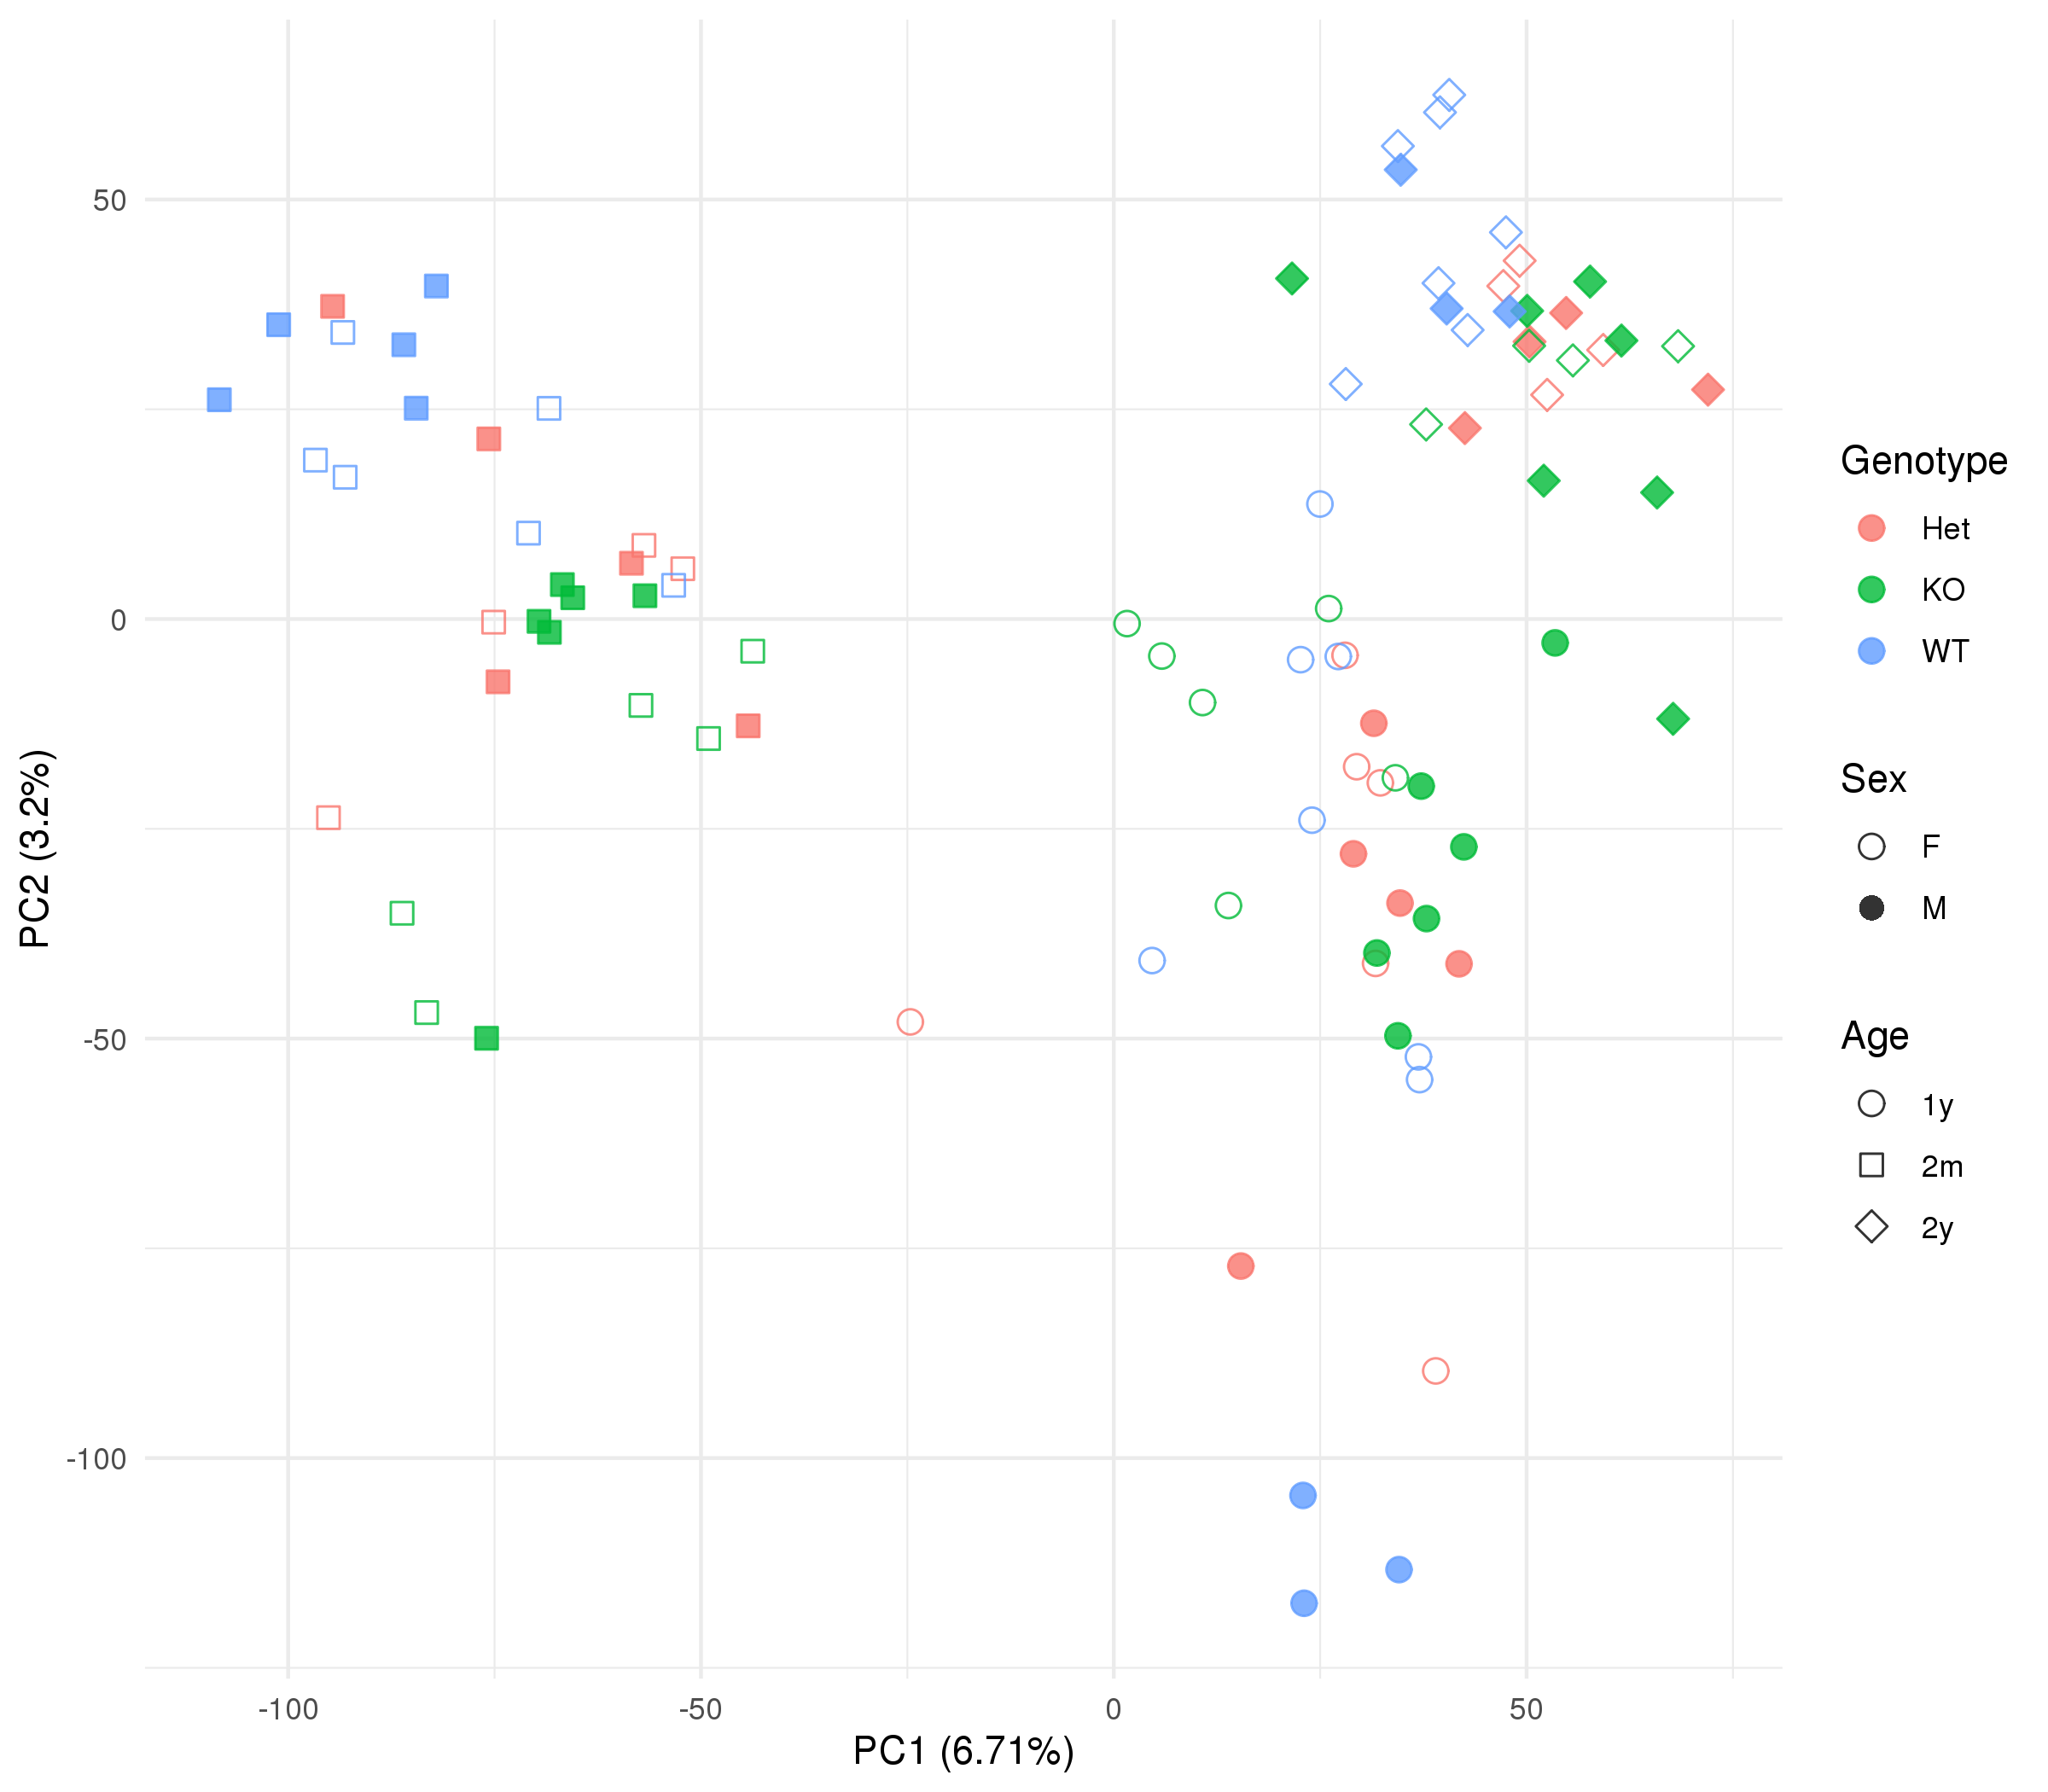
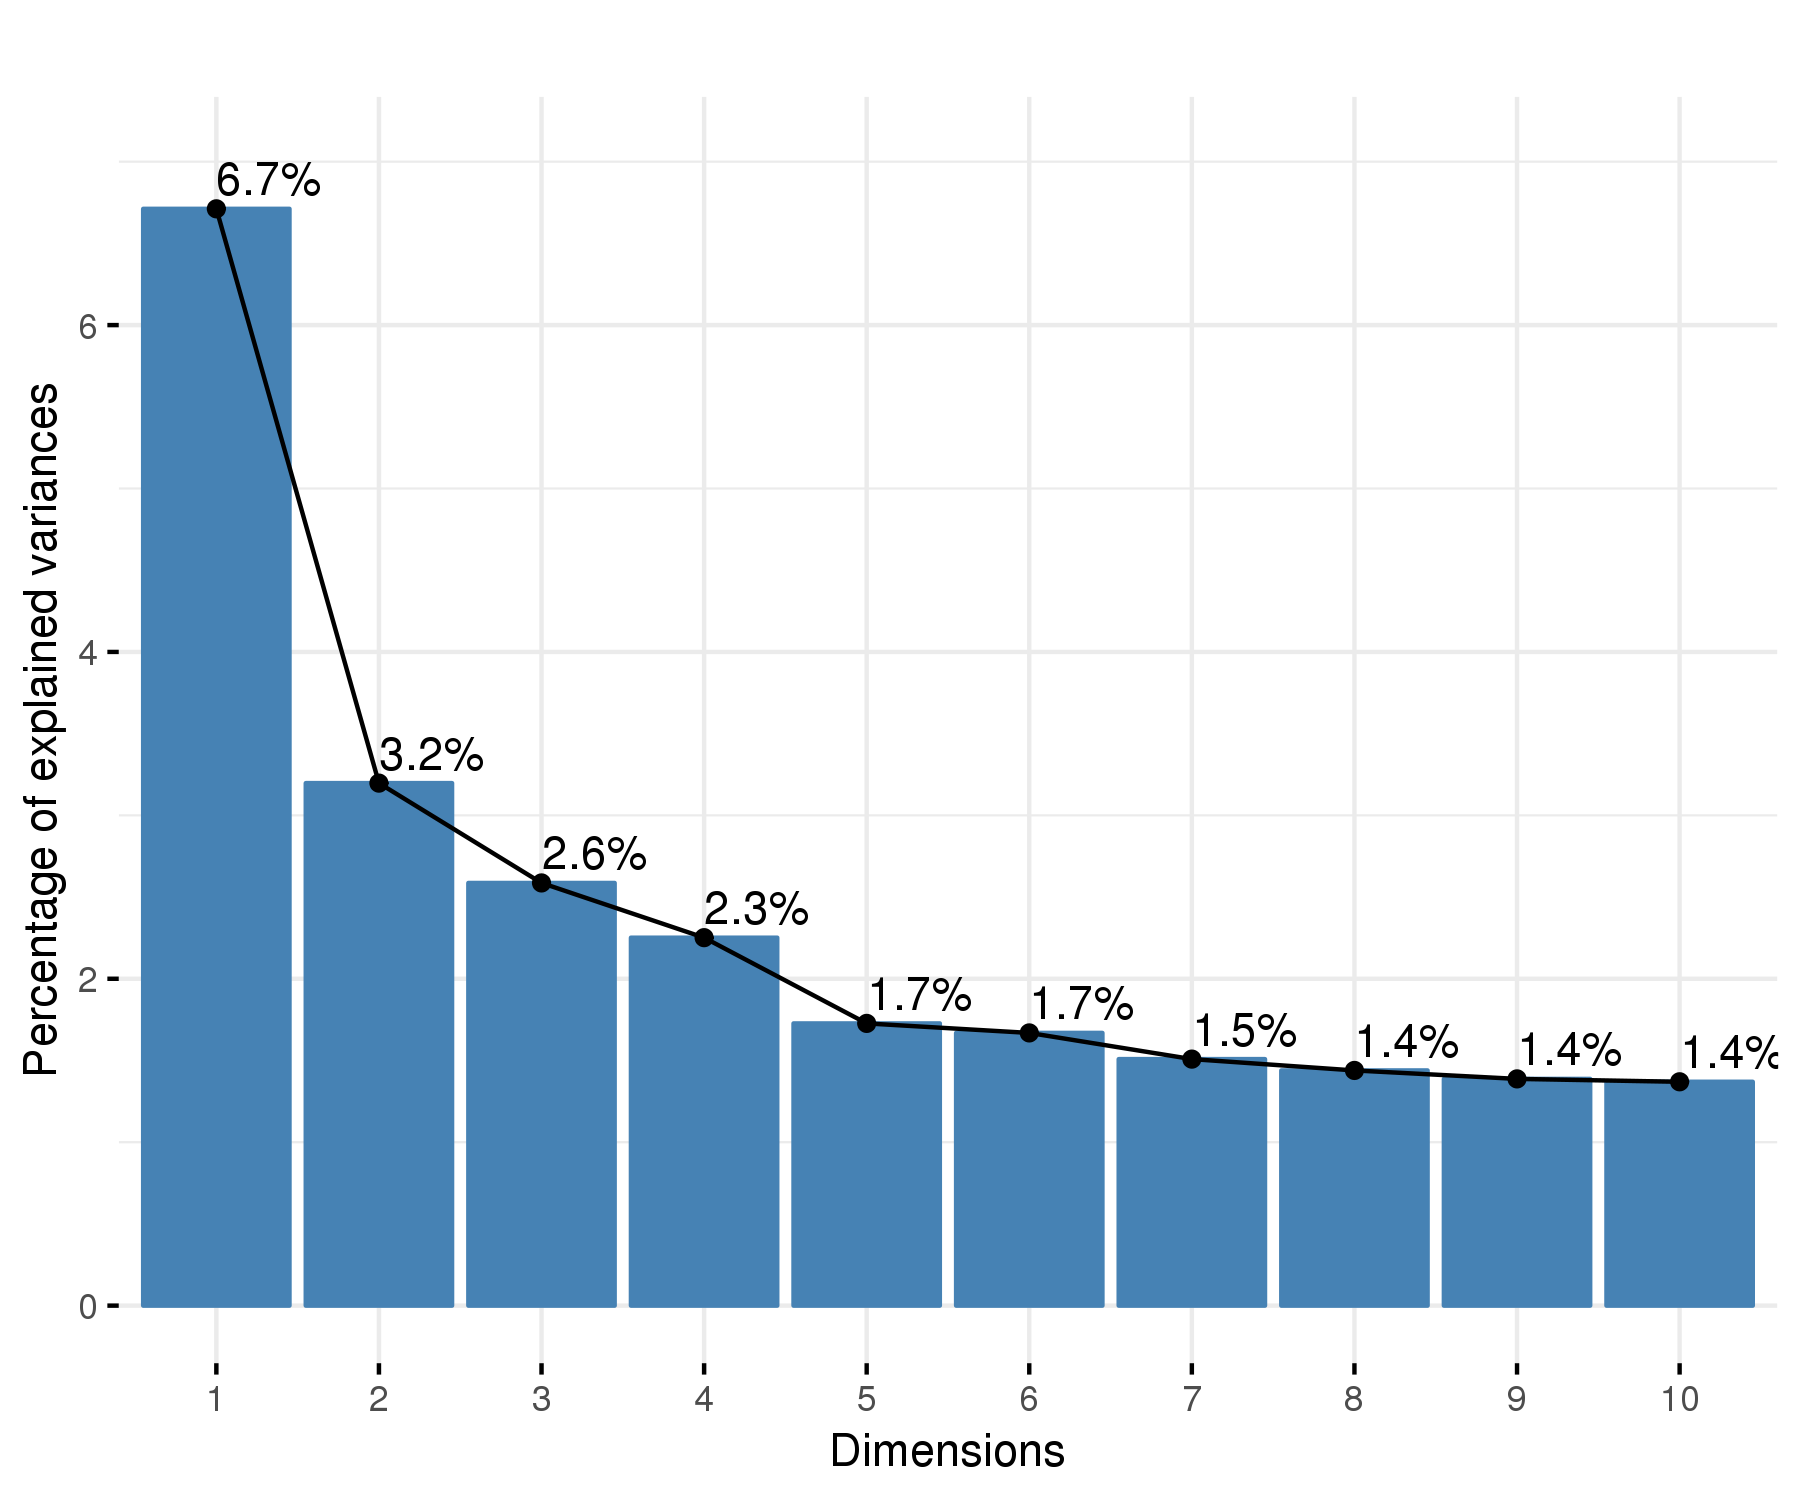
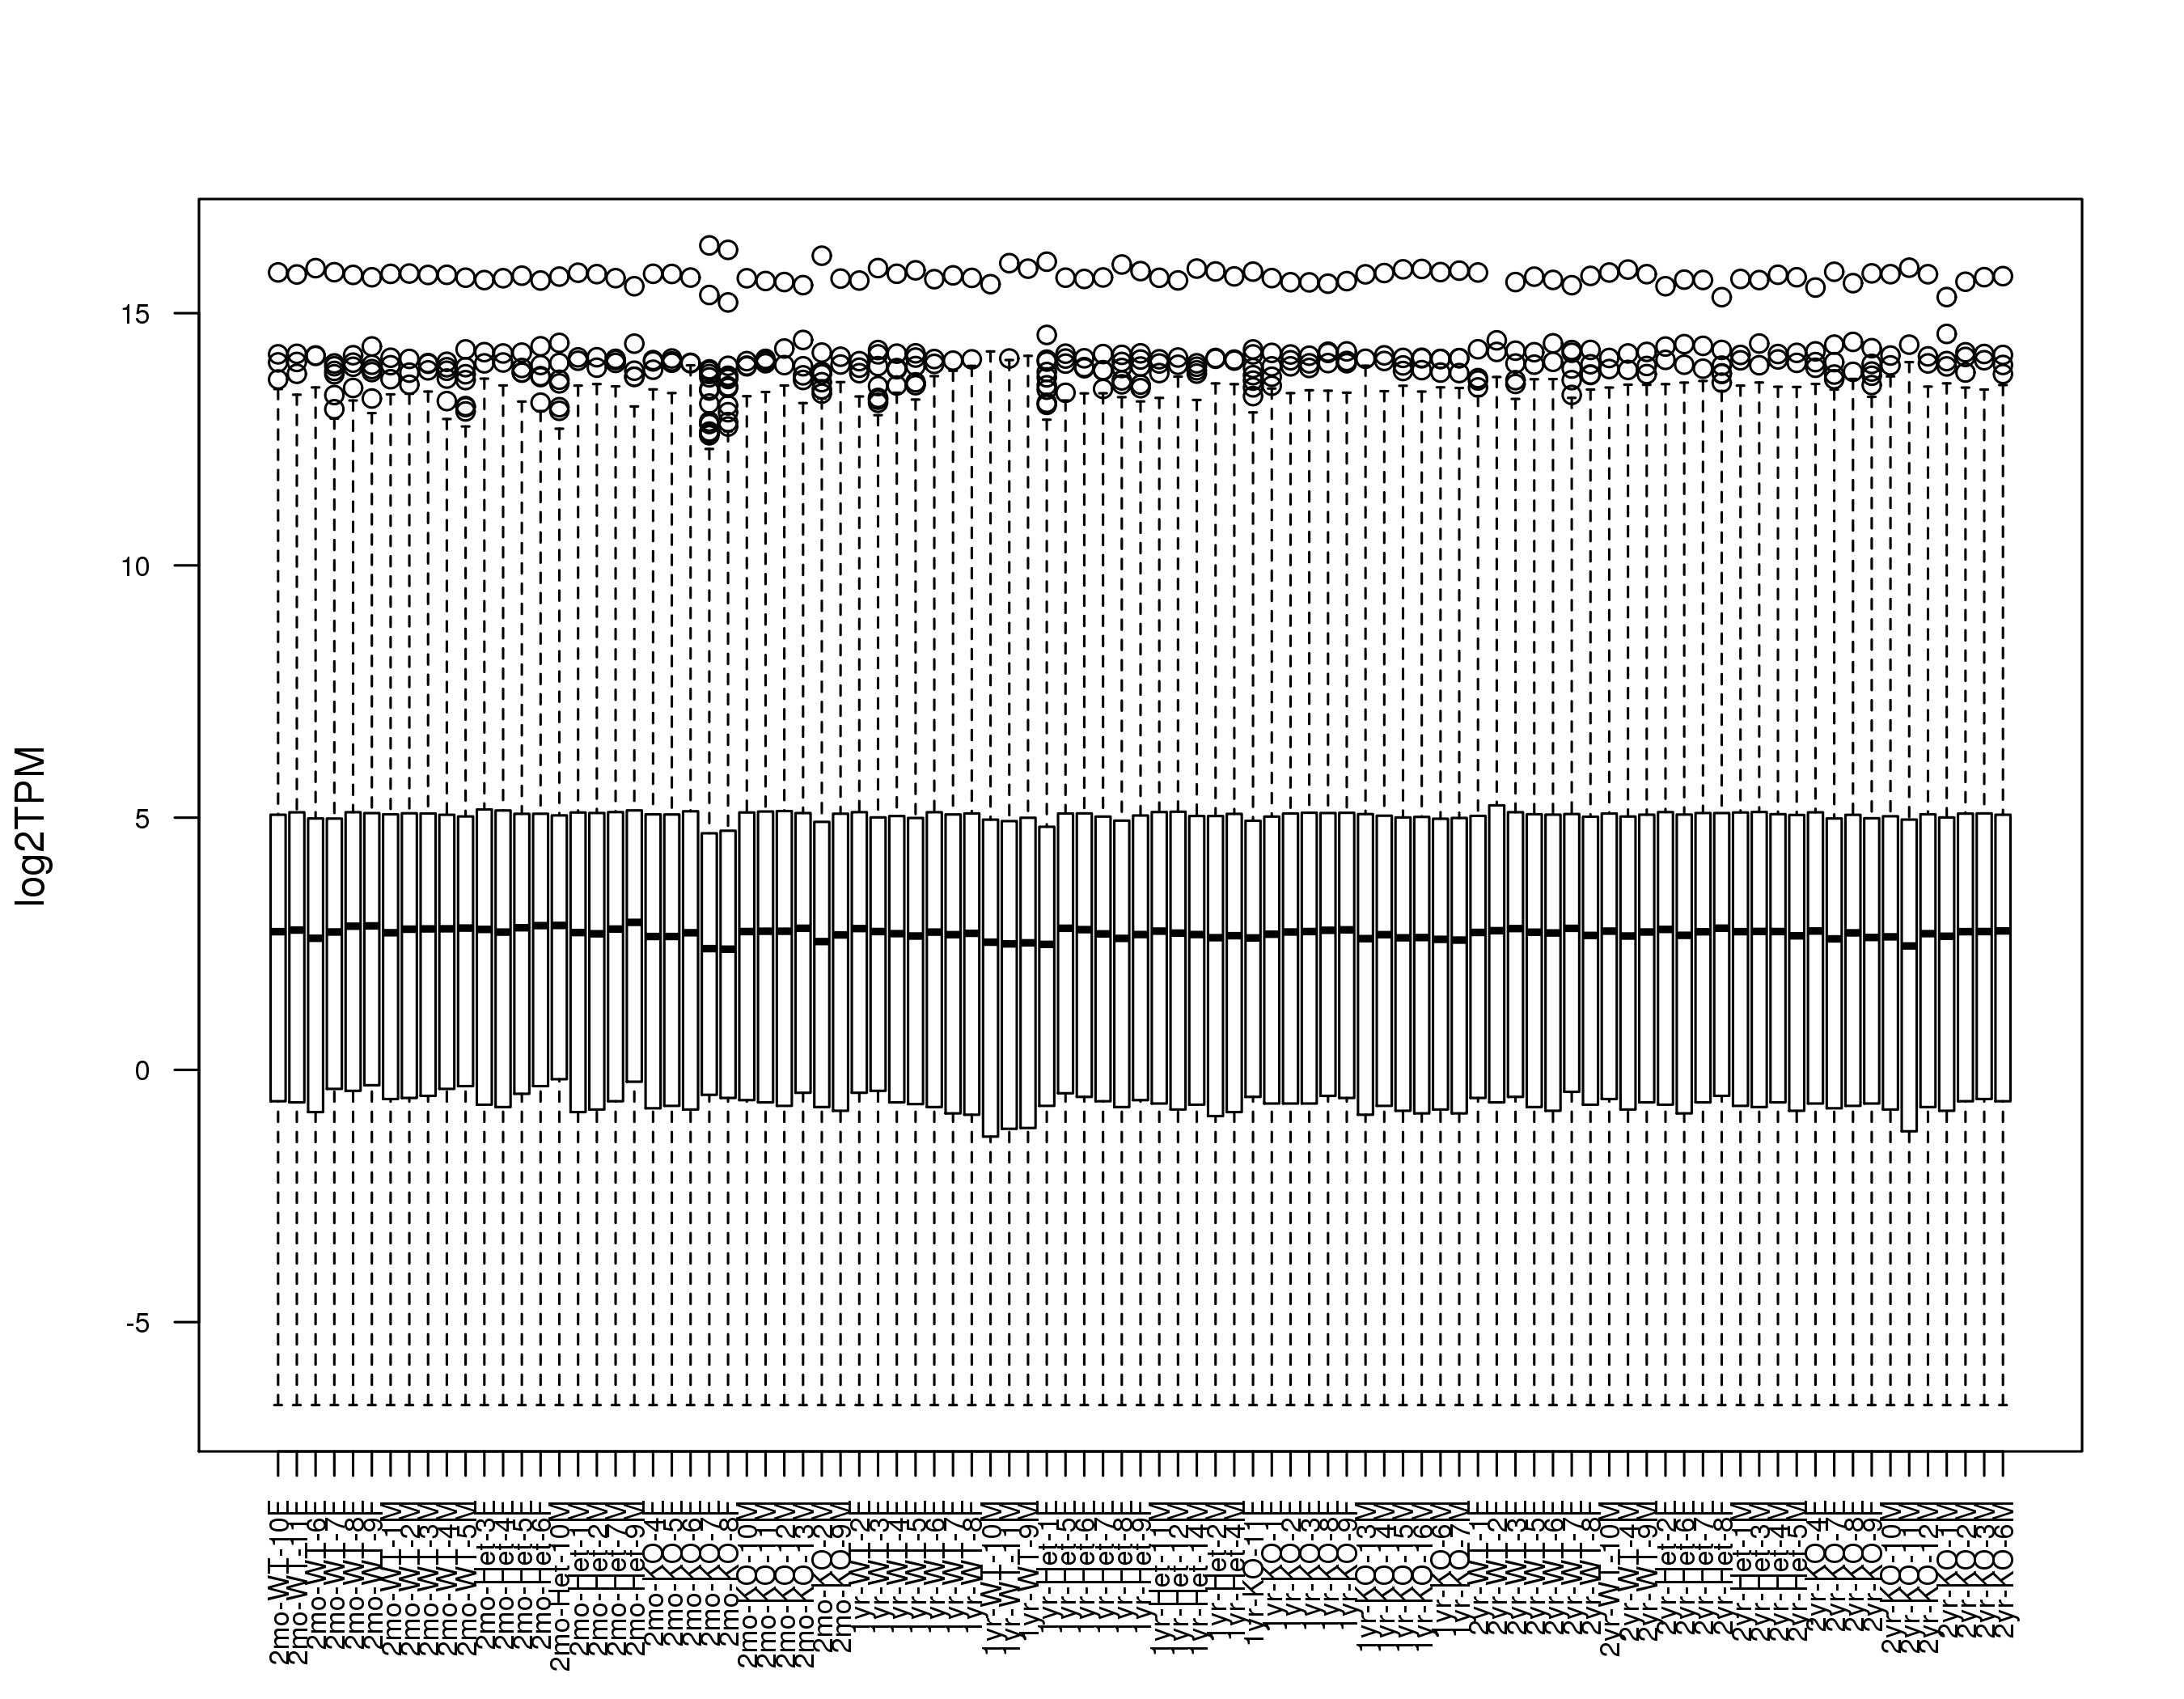
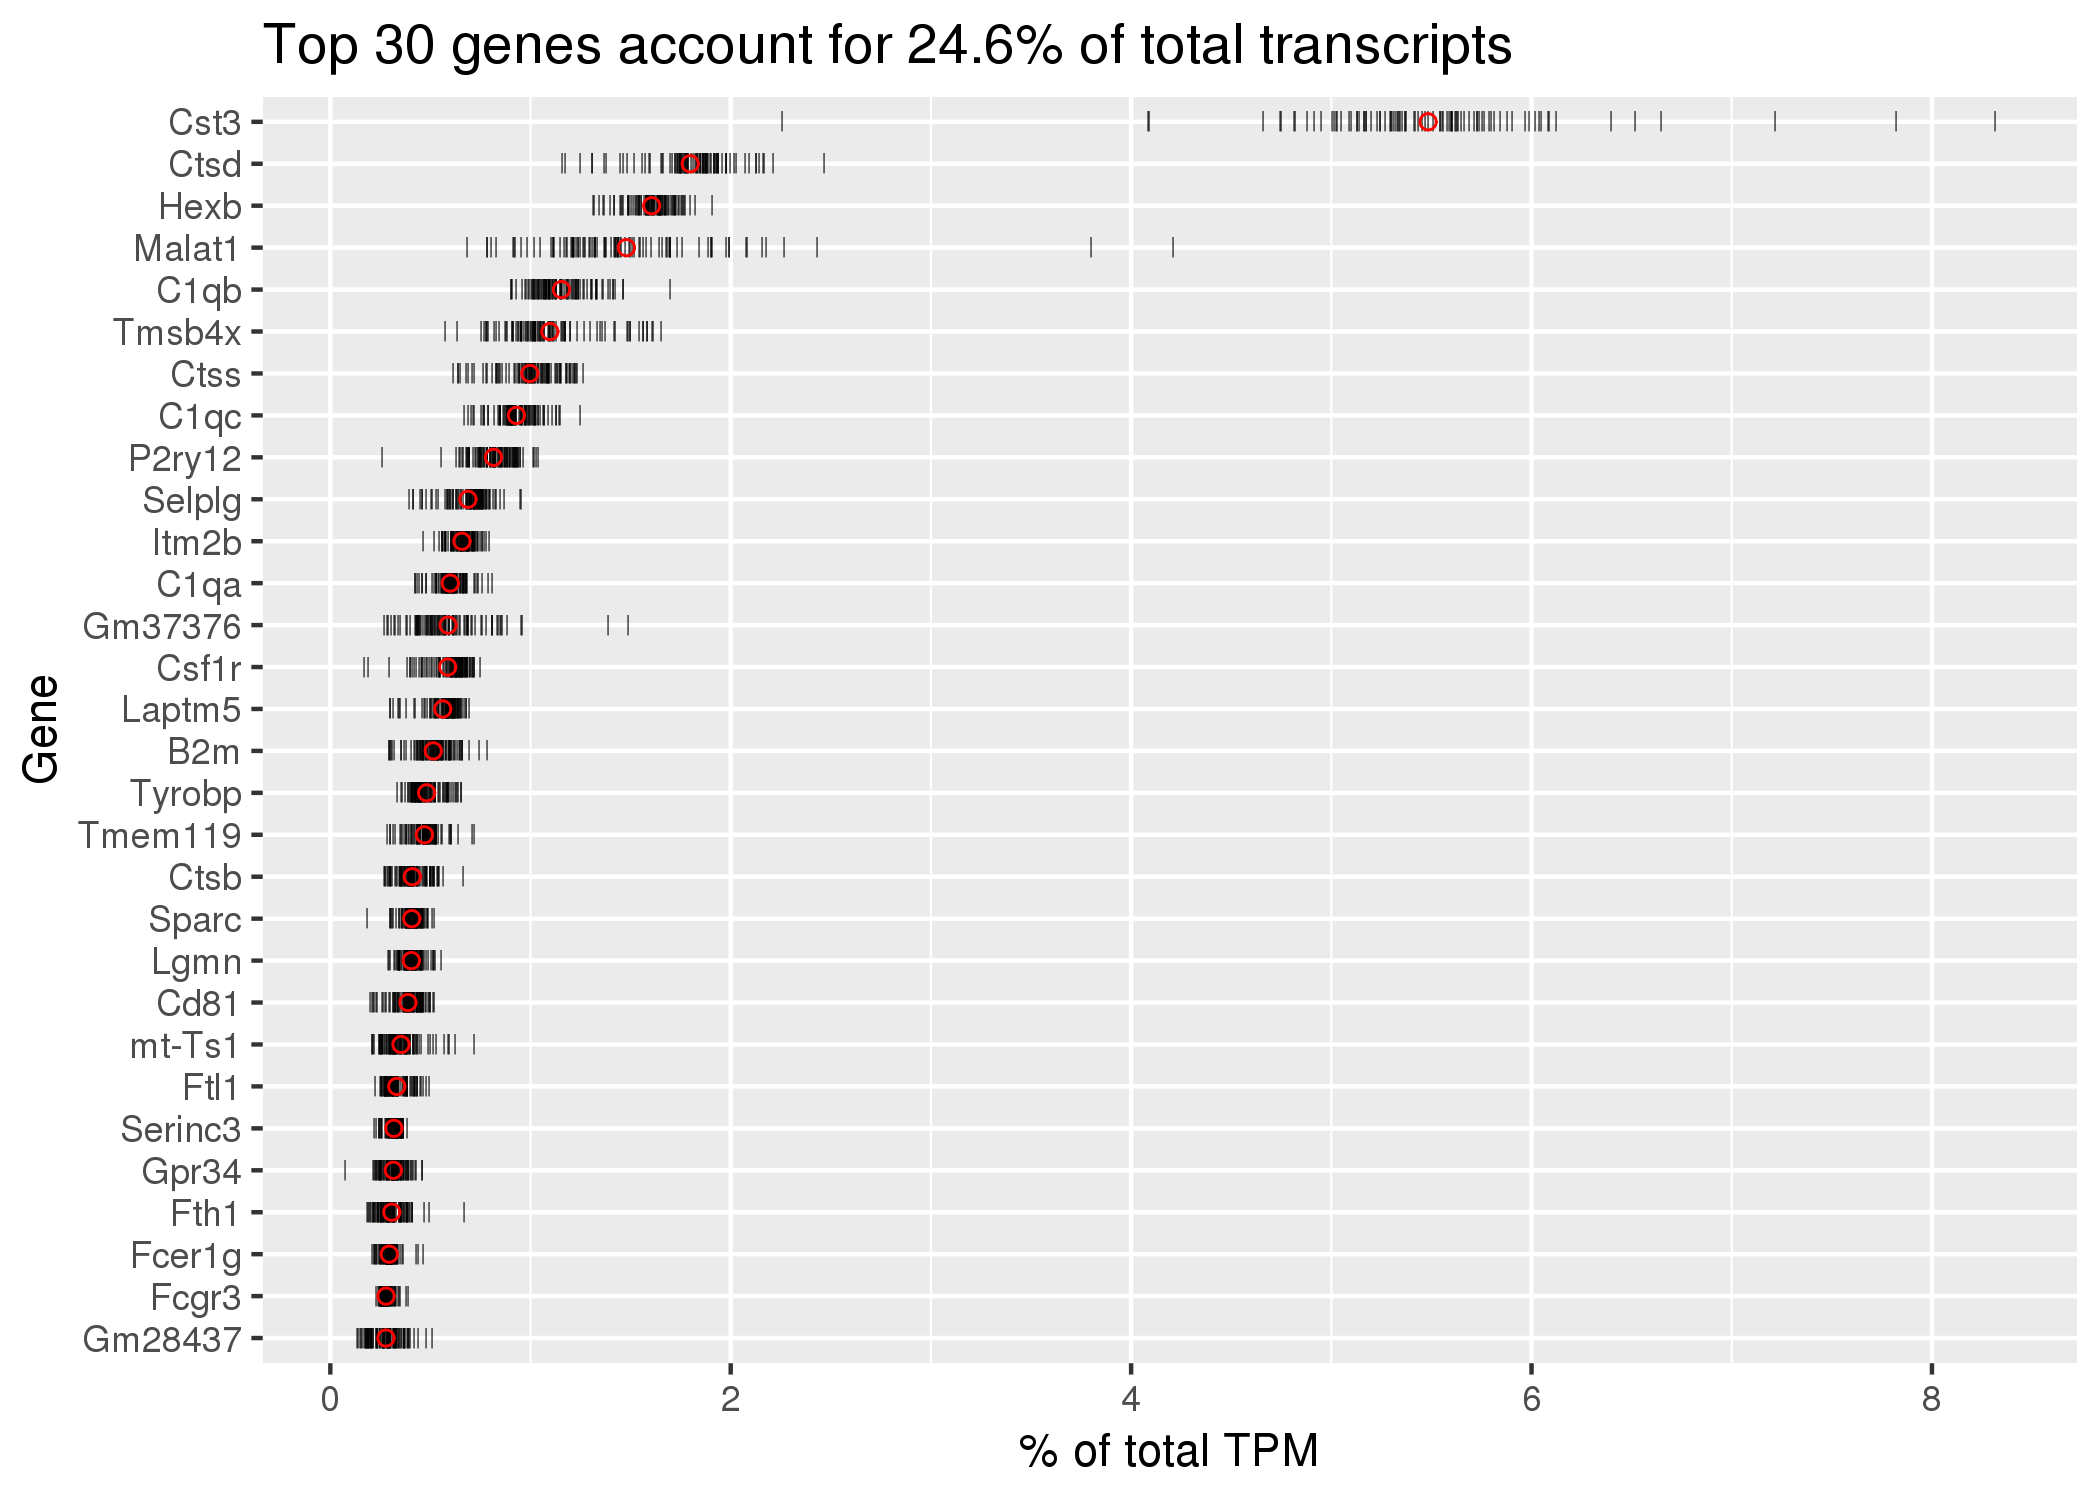
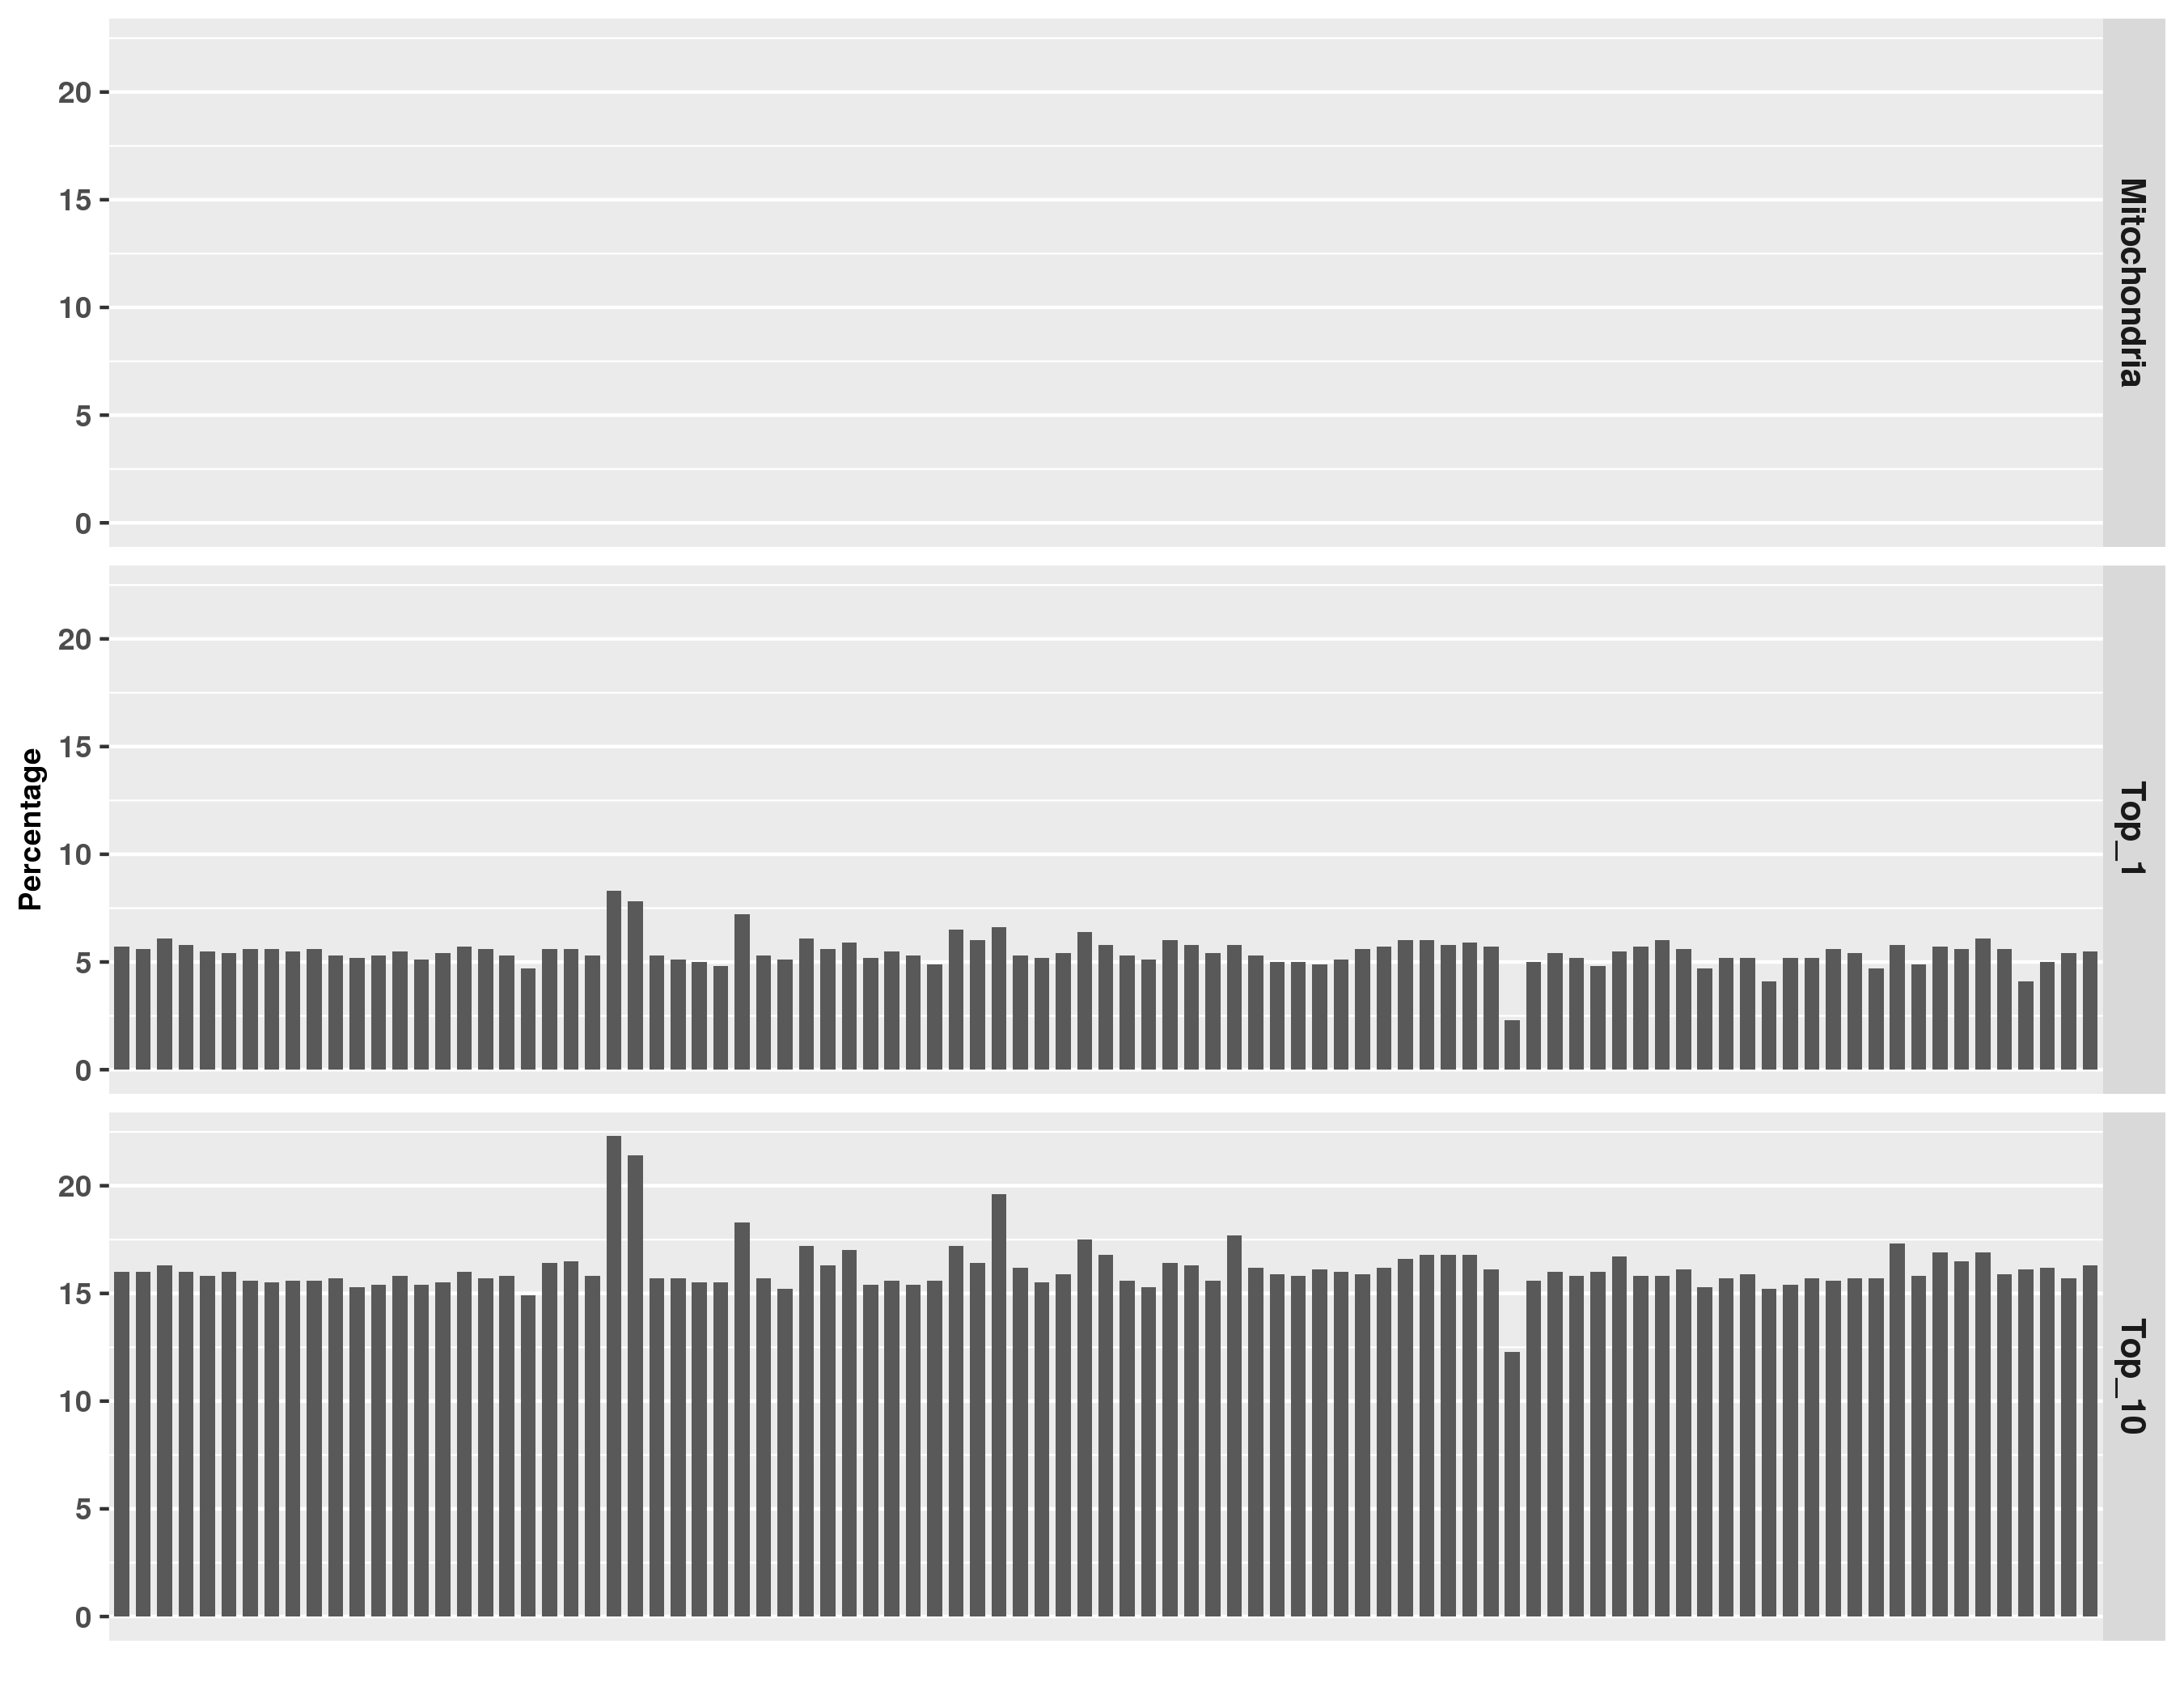
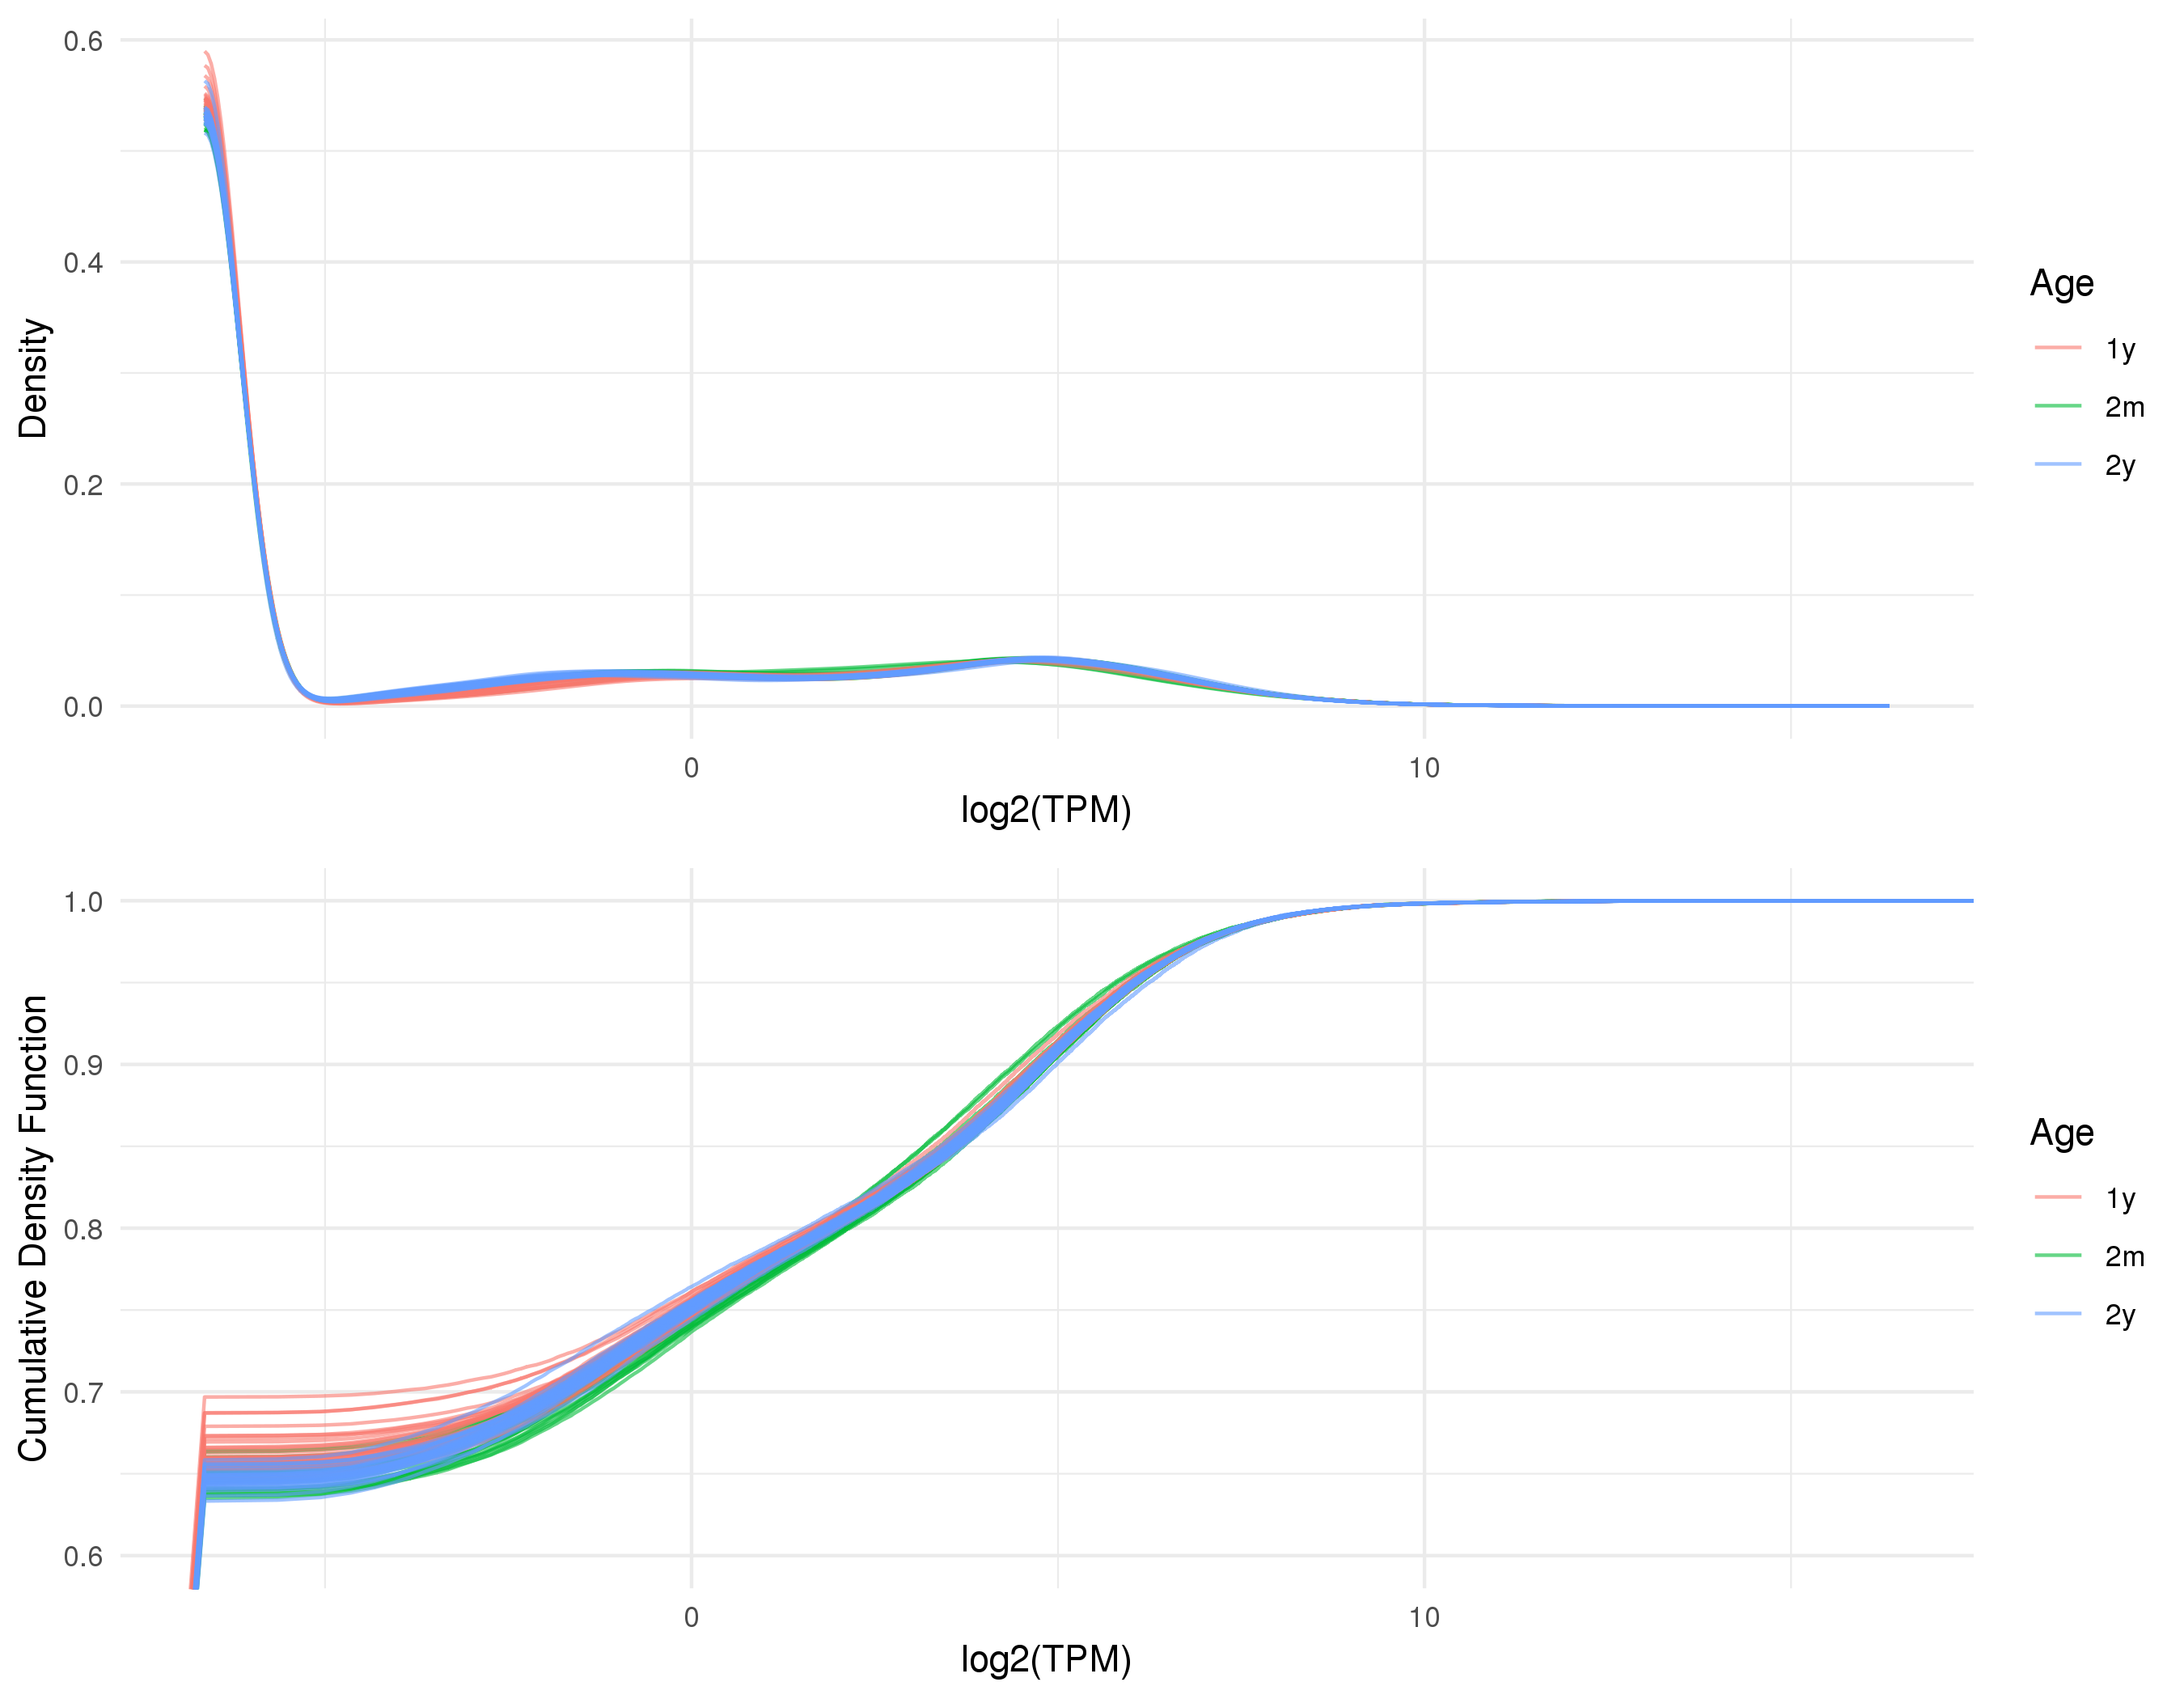
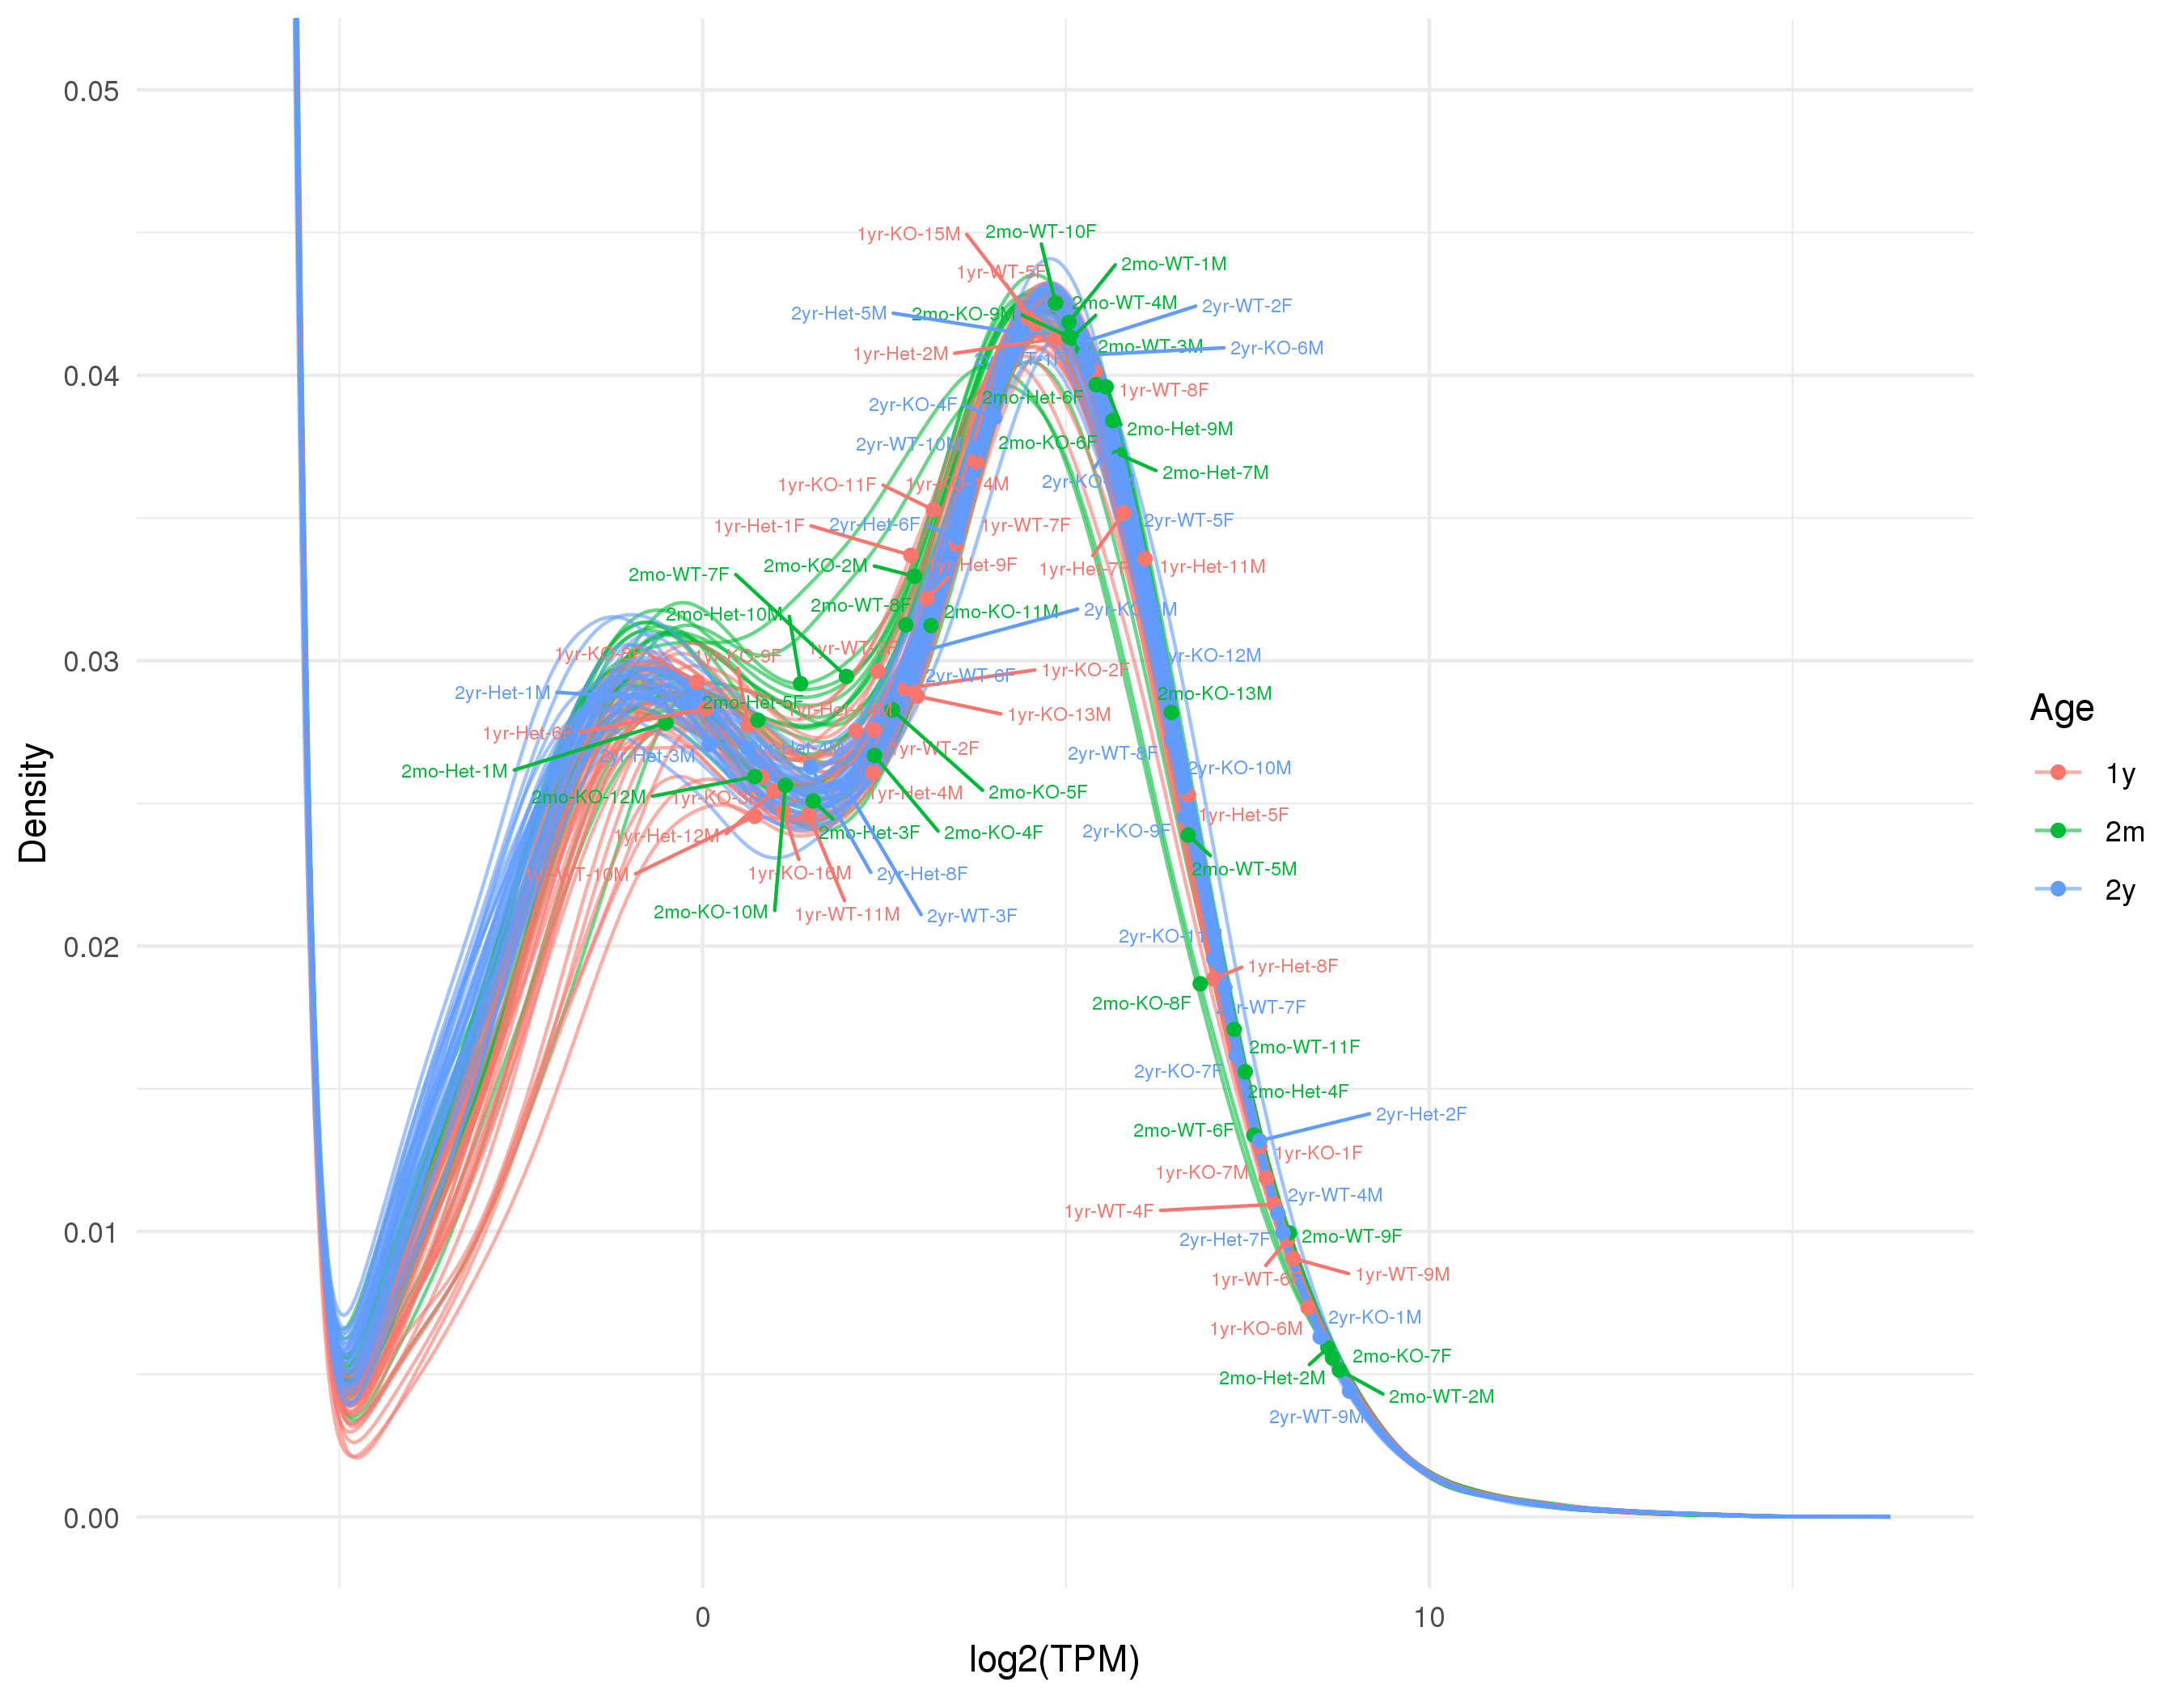
 for interactive plots.
Because of the low RNA content of microglia and our desire to use each animal as an individual sample, we employed low RNA input protocols for RNA-Seq library preparation. cDNA for RNA-Seq libraries was prepared using 10 ng of RNA using the SmartSeq v4 Ultra Low RNA Input Library prep protocol (Clontech 634889) according to the manufacturer's instruction. The cDNA (250 ng starting material) was then tagged and fragmented with the NexteraXT DNA Library Preparation kit (Illumina FC-131-1024) according to the manufacturer's instructions. Quality of amplified cDNA and fragmented libraries was assessed on a Bioanalyzer with the High Sensitivity DNA chips (Agilent 5067-4627). Tagged libraries were pooled (8 nM total DNA) and sequenced on an Illumina HiSeq2500 sequencer, with target depth of 20 million of 50 bp paired end reads.
 Click on the image above to access the interactive plot.
Raw Data
| sample.annotation.txt | sample annotation file |
| run.config.txt | configuration file |
| star-mapping-summary.txt | read mapping summary for STAR run |
| fc-counting-summary.txt | read counting summary for featureCounts run |
| fc-gene-counts.txt | gene counts table |
| fc-gene-rpkm.txt | RPKM table, calculated from fc-gene-counts.txt |
| rsem-gene-tpm.txt | TPM table, calculated by RSEM algorithm |
| expr-gene-corr.txt | All-against-all gene expression correlation matrix |
| RNASeq-snp-corr.txt | All-against-all SNP correlation matrix |
| RNASeq-merged-metrics.txt | Merged RNA-seq metrics from mapping, counting, distribution and QC |
